RabbitMQ Channels Overview - Seventh State RabbitMQ Support 1,3201,320
4/3/2024
11/27/2024
2
RabbitMQ
>=10.4.0
Prometheus
Description
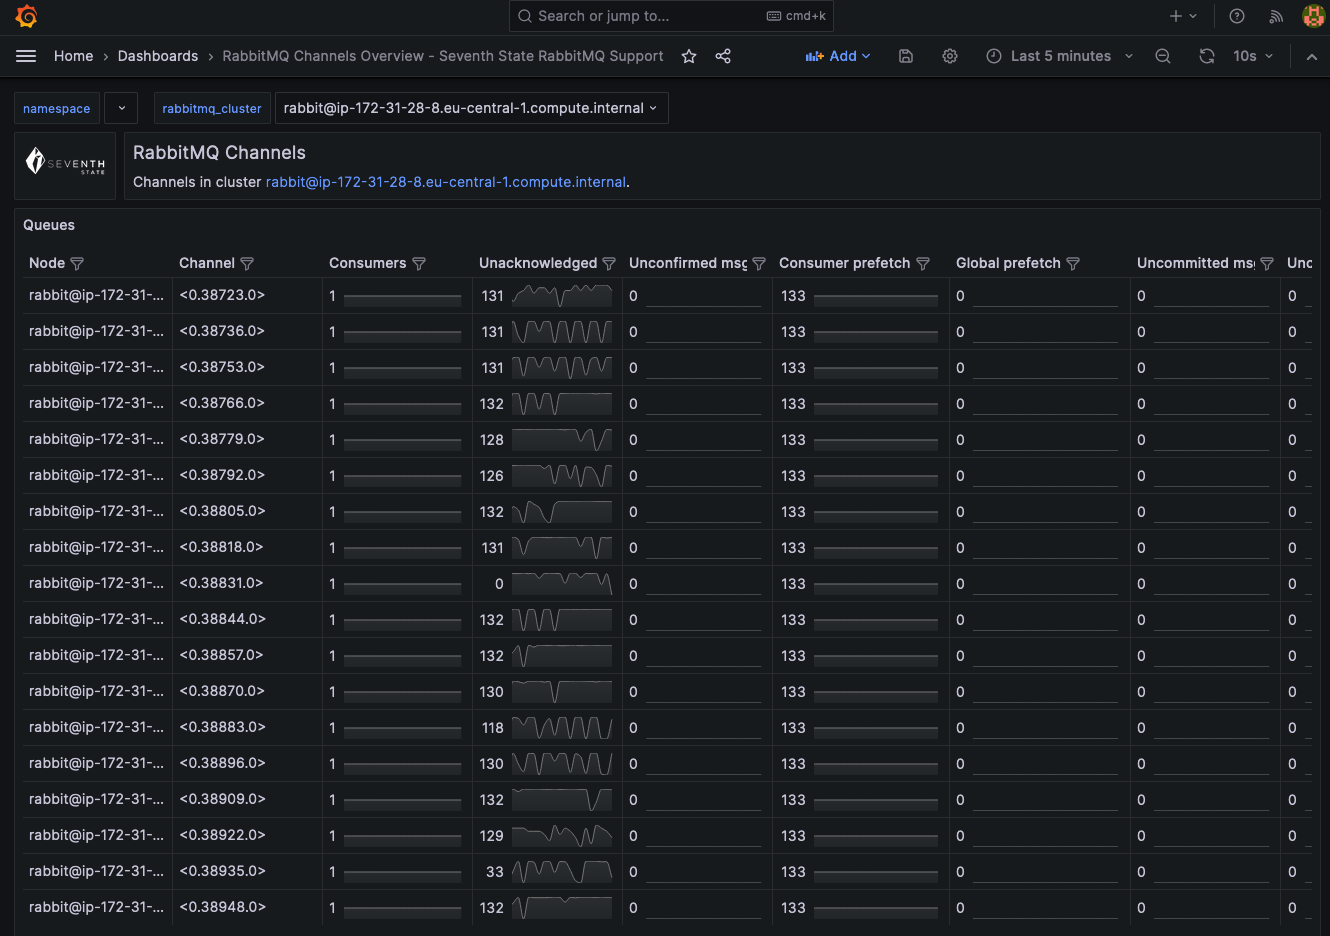
Overview of all channels in a RabbitMQ Cluster
Screenshots
Used Metrics 1010
rabbitmq_cluster
rabbitmq_detailed_channel_acks_uncommitted
rabbitmq_detailed_channel_consumers
rabbitmq_detailed_channel_messages_unacked
rabbitmq_detailed_channel_messages_uncommitted
rabbitmq_detailed_channel_messages_unconfirmed
rabbitmq_detailed_channel_prefetch
rabbitmq_detailed_consumer_prefetch
rabbitmq_identity_info
rabbitmq_node
Get Dashboard✕
Download
Copy to Clipboard