Proxmox via Prometheus 29,19729,197 4.2 (5 reviews)
6/15/2019
4/20/2023
5
>=9.3.2
Prometheus
Description
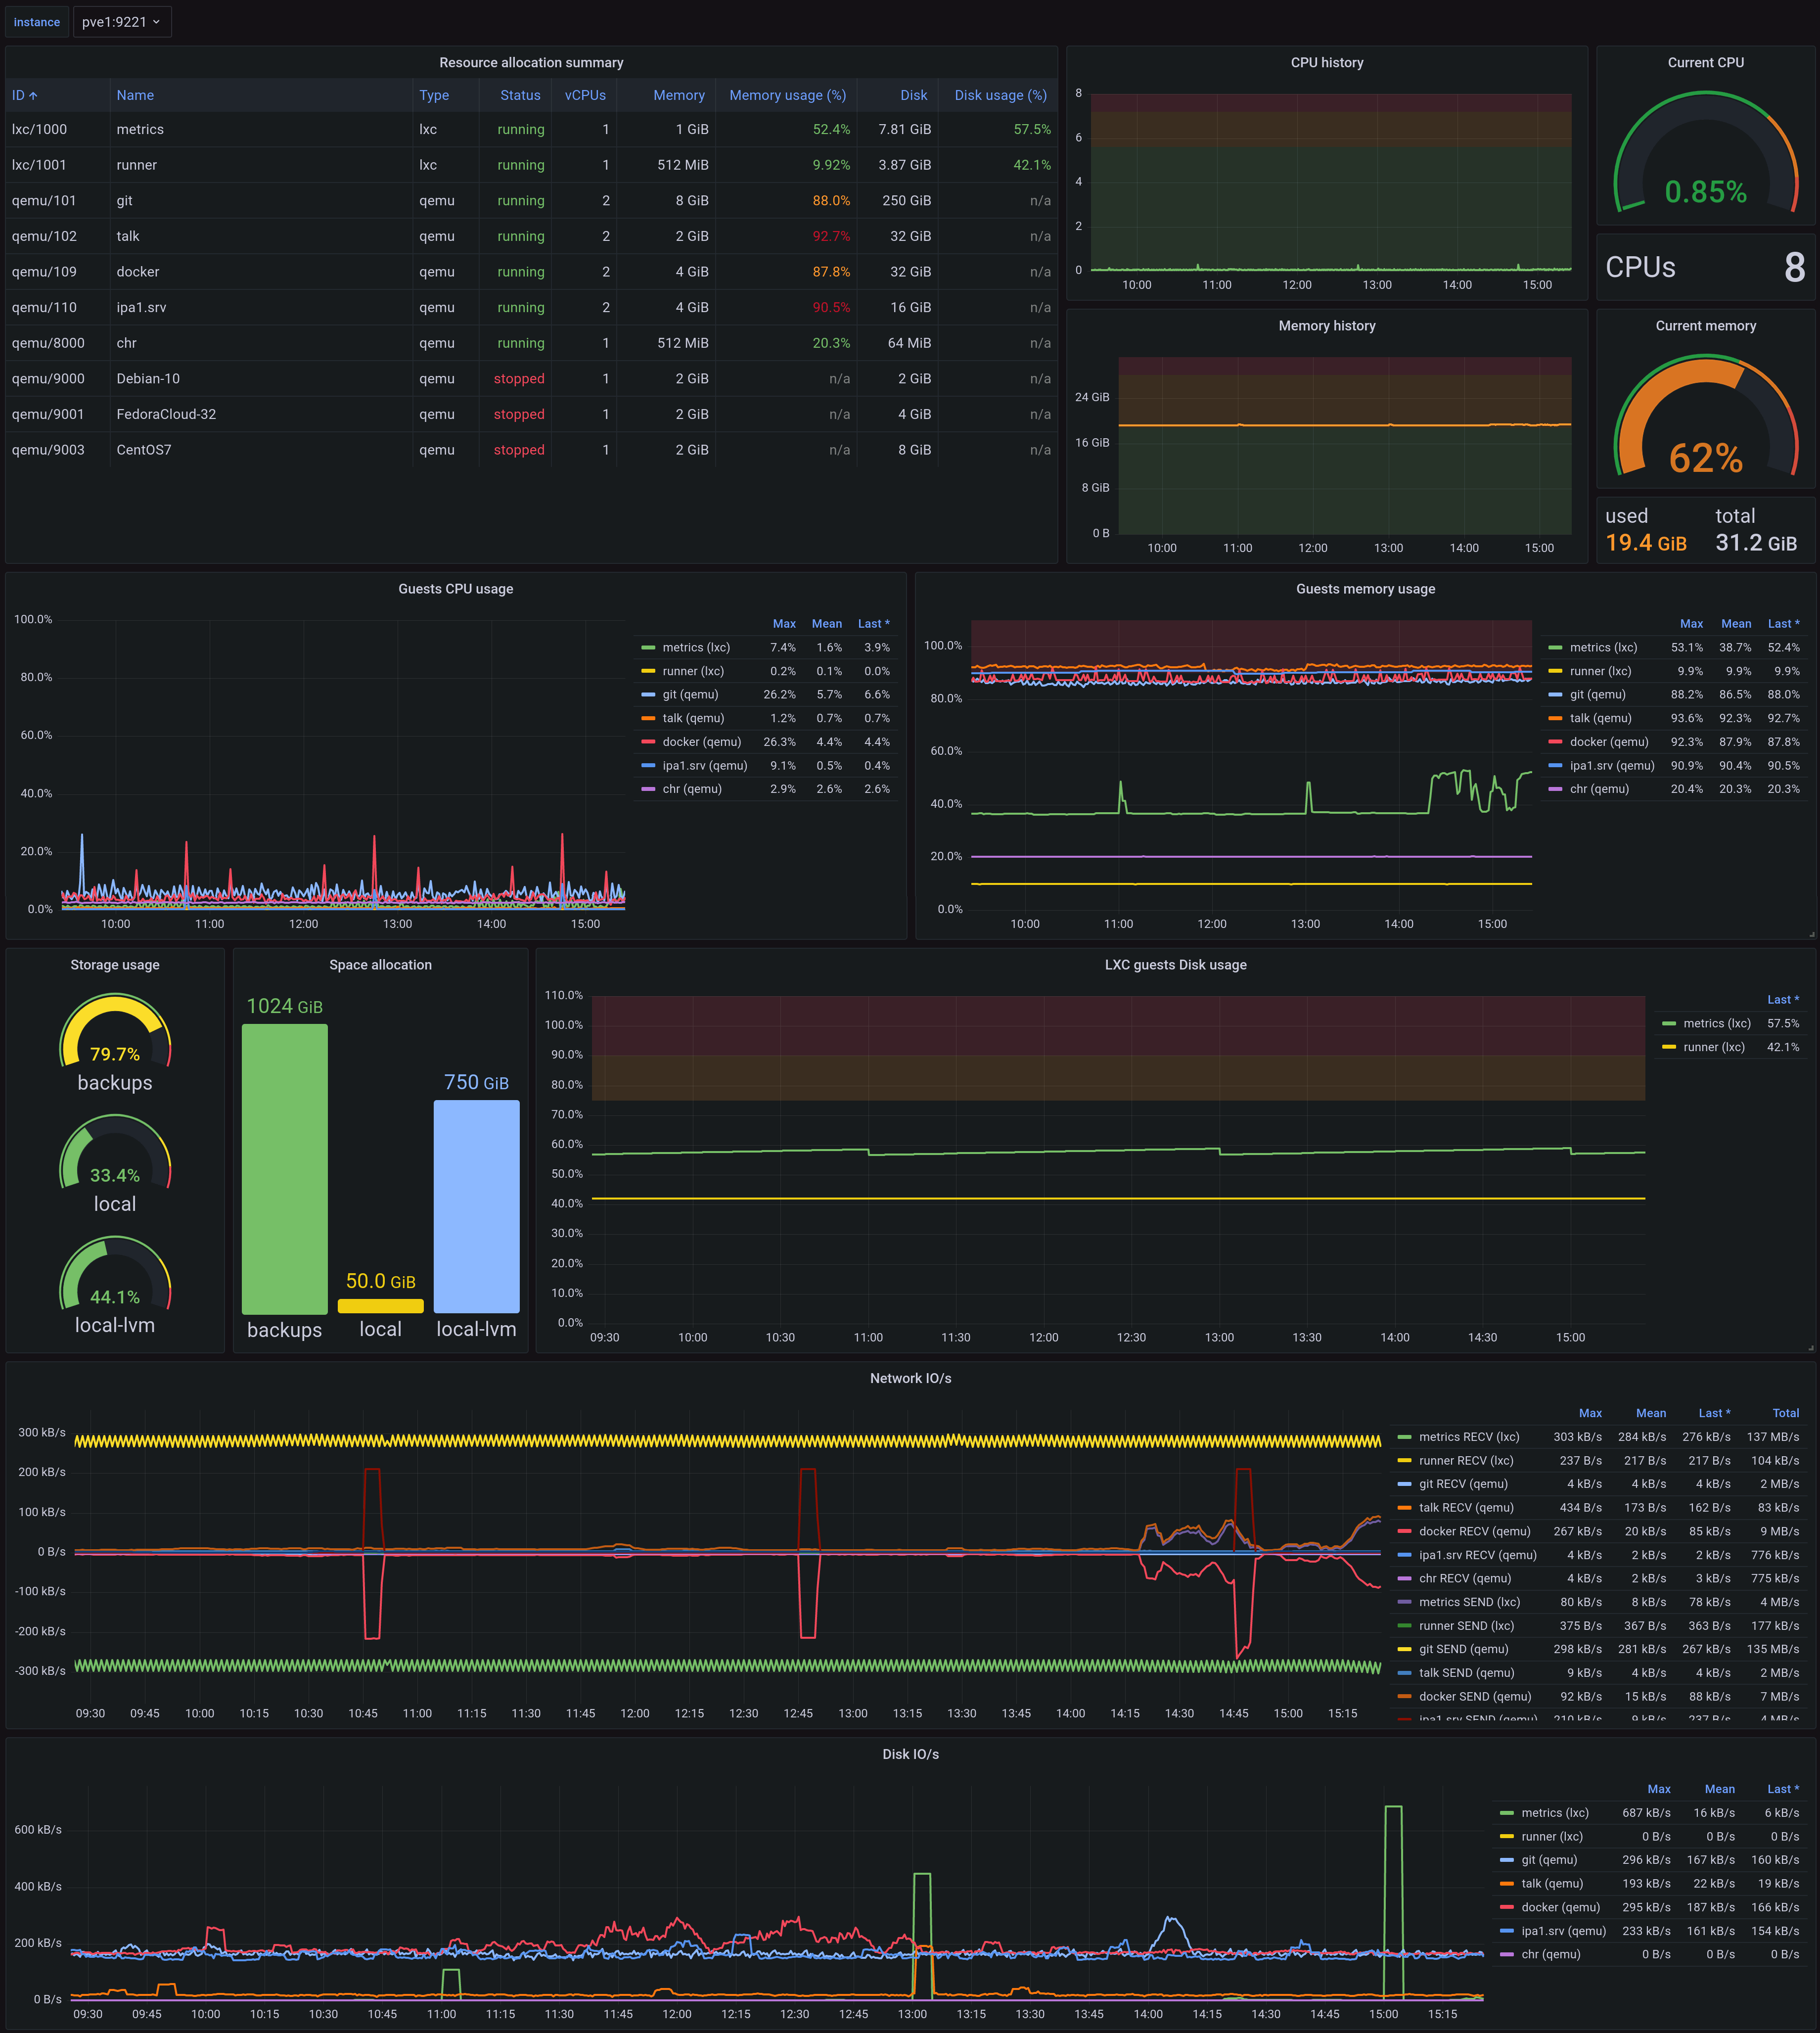
Proxmox Virtual Environment Dashboard
Screenshots
Used Metrics 1717
name
pve_cpu_usage_limit
pve_cpu_usage_ratio
pve_disk_read_bytes
pve_disk_size_bytes
pve_disk_usage_bytes
pve_disk_write_bytes
pve_guest_info
pve_memory_size_bytes
pve_memory_usage_bytes
pve_network_receive_bytes
pve_network_transmit_bytes
pve_node_info
pve_storage_info
pve_up
storage
type
Get Dashboard✕
Download
Copy to Clipboard