Proxmox VE 7,2487,248 4.7 (3 reviews)
10/30/2020
2/25/2021
6
Host Metrics
>=7.1.1
Prometheus
Description
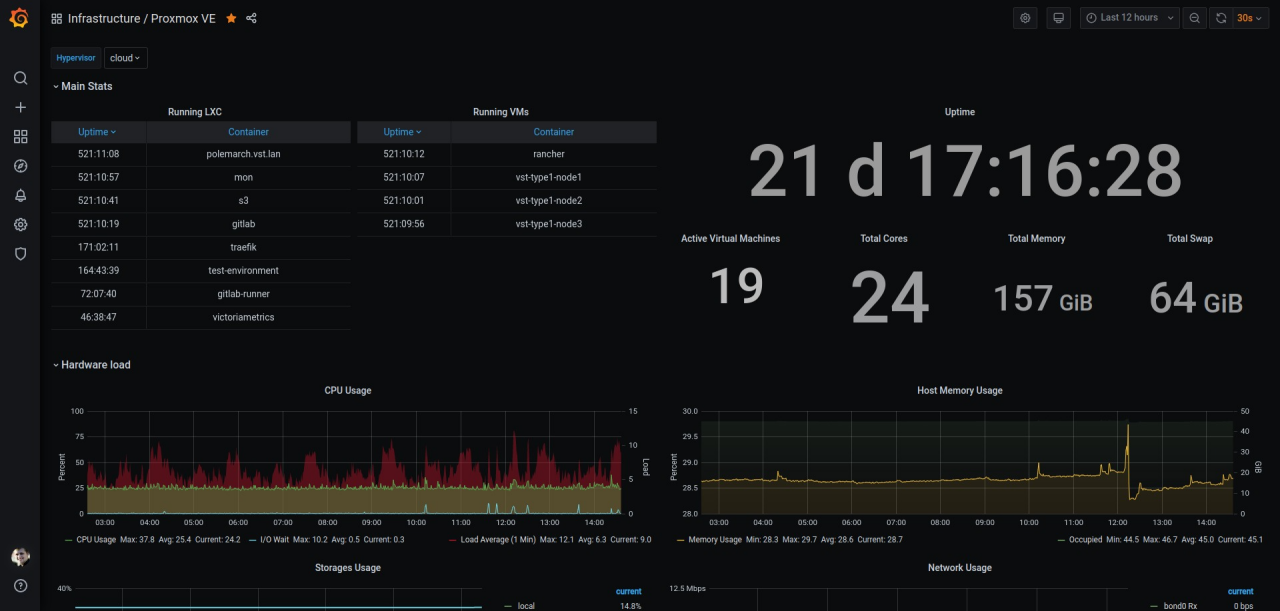
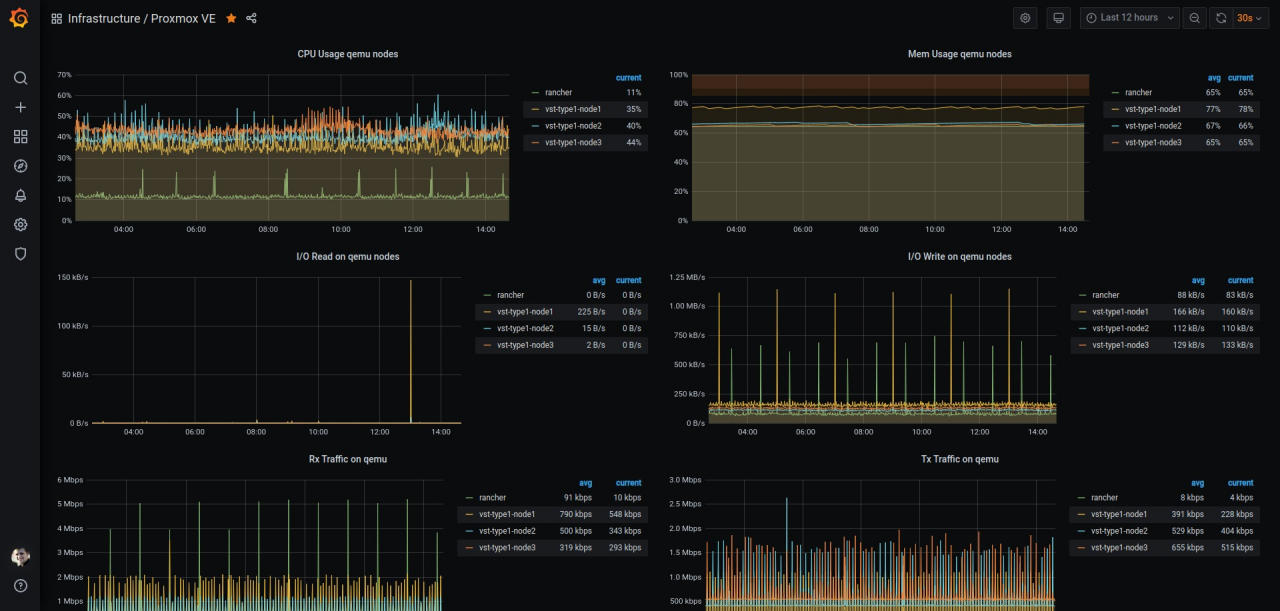
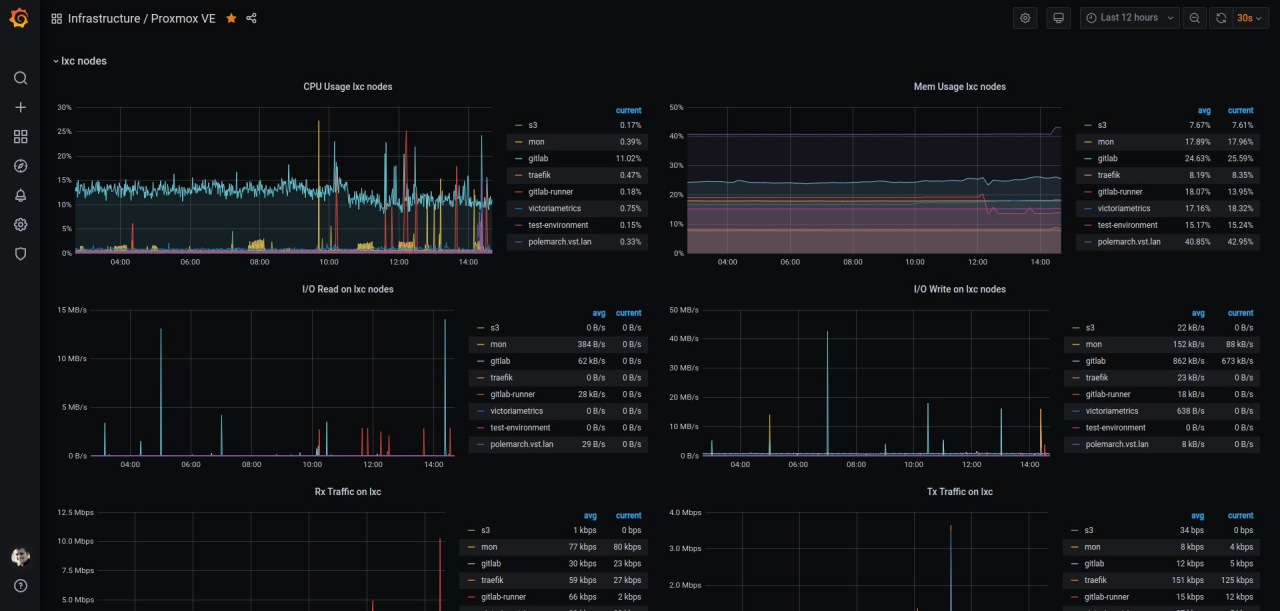
Proxmox VictoriaMetrics dashboard
Screenshots
Used Metrics 1212
cpustat_avg1
cpustat_cpu
cpustat_cpus
cpustat_wait
memory_memtotal
memory_memused
memory_swaptotal
nics_receive
nics_transmit
system_total
system_uptime
system_used
Get Dashboard✕
Download
Copy to Clipboard