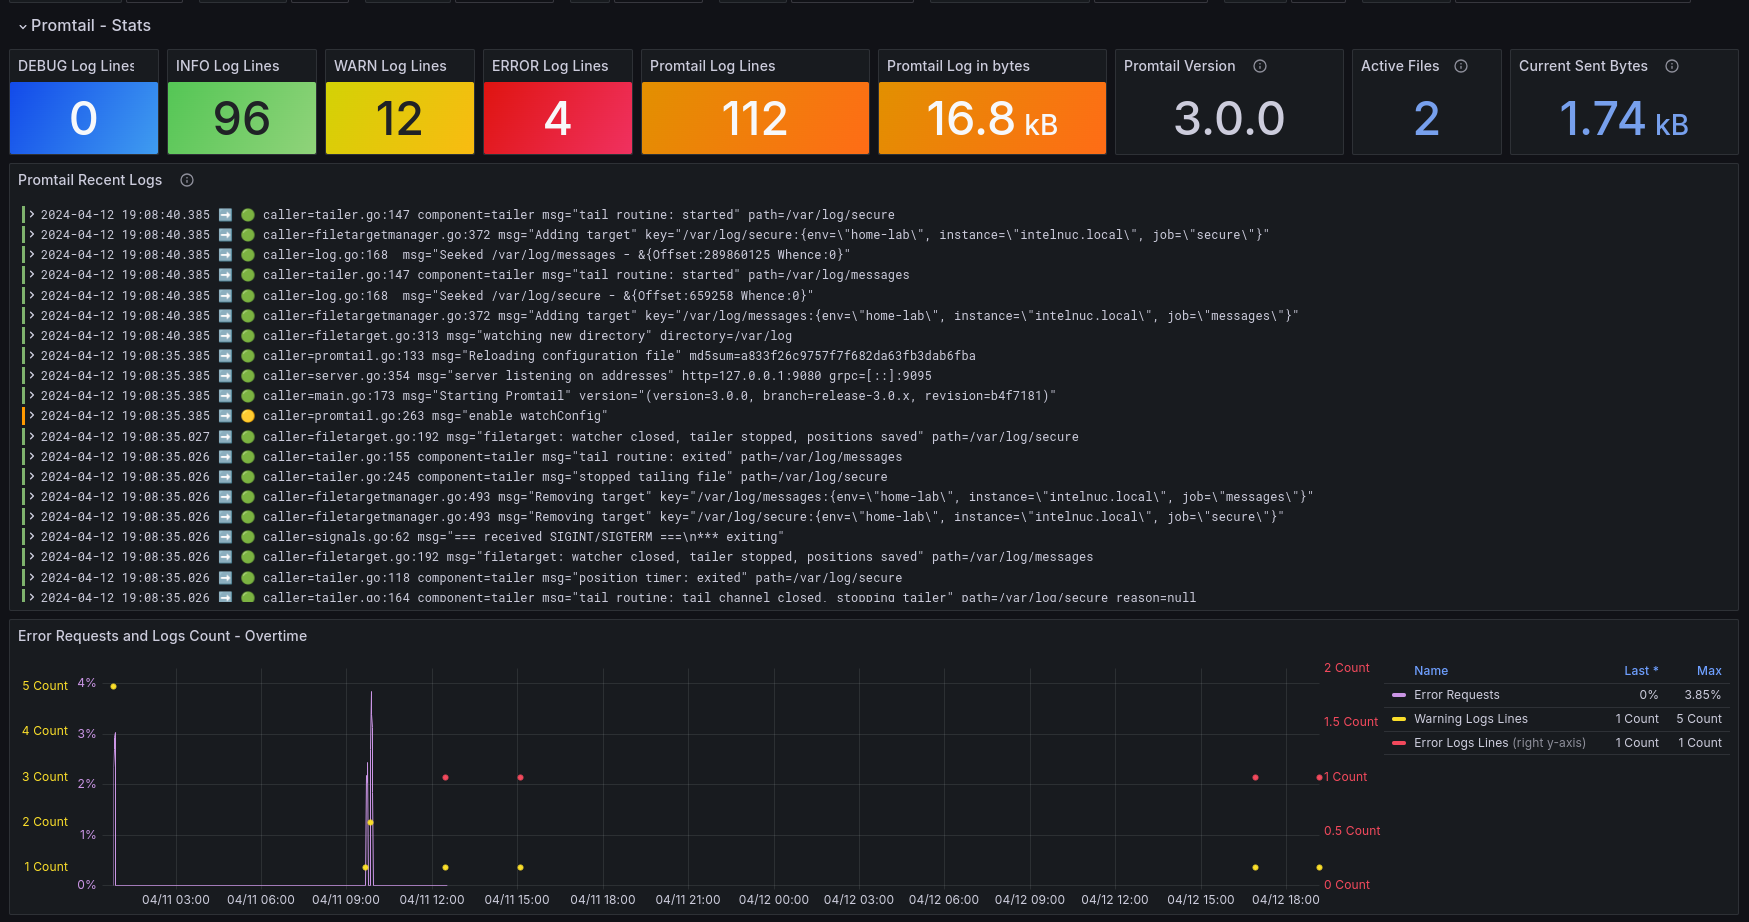
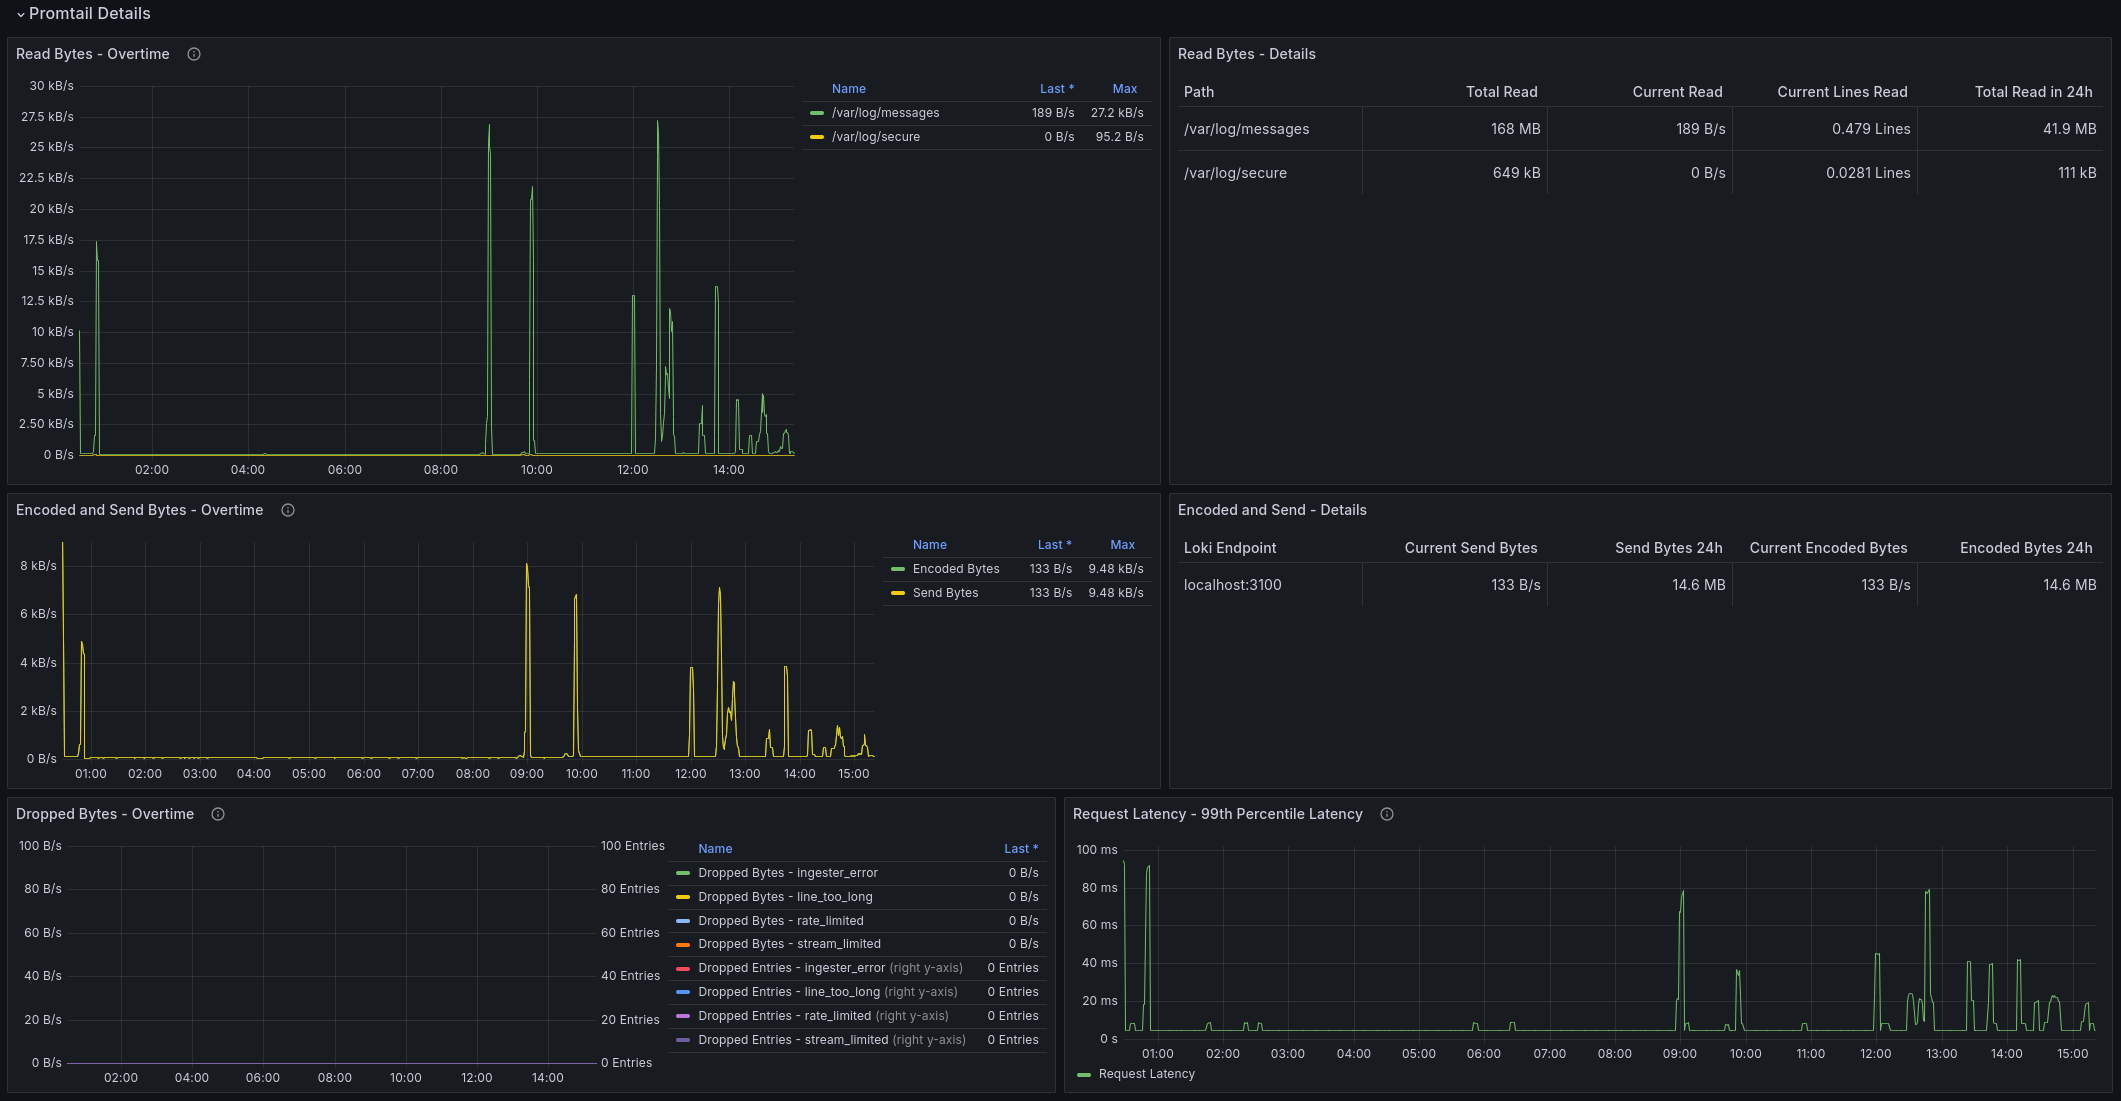
Promtail Monitoring - Metrics and Logs 6,2966,296
4/12/2024
4/12/2024
1
>=10.4.1
LokiPrometheus
Description
Monitor Promtail metrics and logs
Screenshots
Used Metrics 2121
__auto
__error__
bytes_over_time
debug
error
filter
info
interval
level
line_format
promtail_build_info
promtail_dropped_bytes_total
promtail_dropped_entries_total
promtail_encoded_bytes_total
promtail_files_active_total
promtail_read_bytes_total
promtail_read_lines_total
promtail_request_duration_seconds_bucket
promtail_request_duration_seconds_count
promtail_sent_bytes_total
warn
Get Dashboard✕
Download
Copy to Clipboard