Prometheus Stats 1,255,0851,255,085
6/9/2016
6/23/2016
2
Host Metrics
>=3.1.0
Prometheus
Description
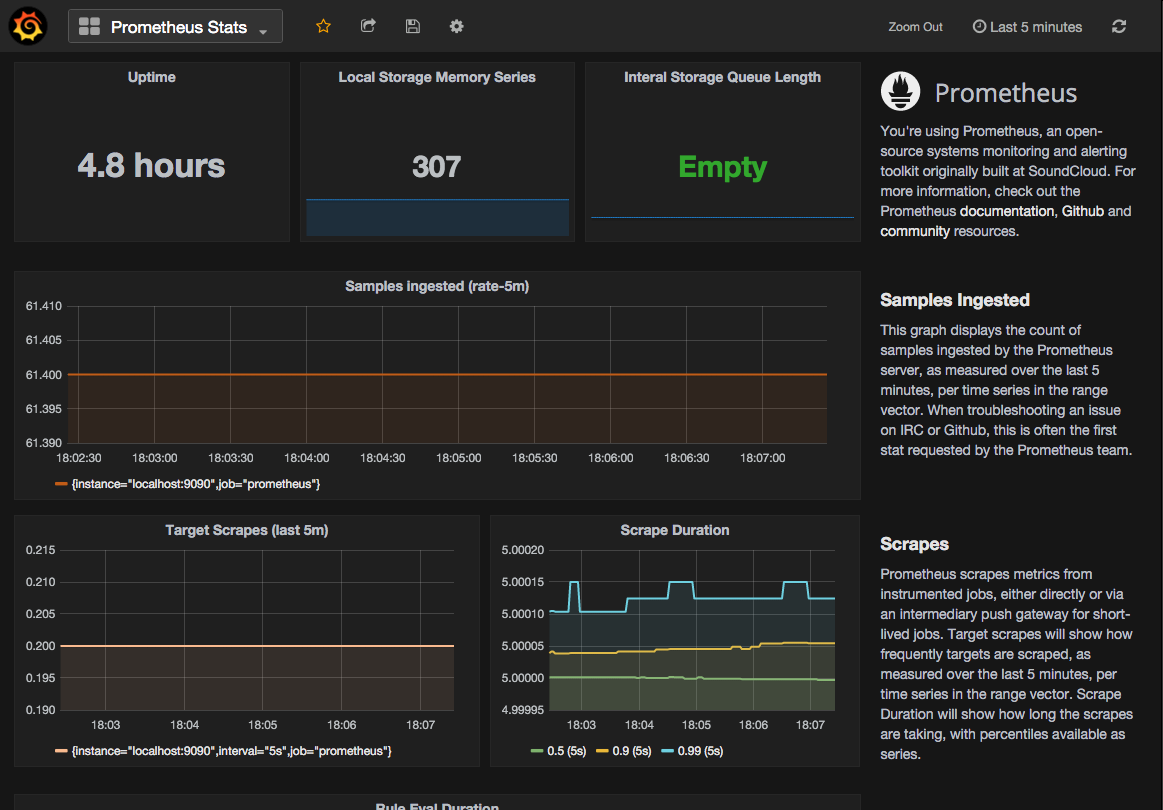
This dashboard monitors core Prometheus metrics to provide visibility into scrape health, query performance, and resource usage. It typically highlights metrics such as up, http_request_duration_seconds, and process_resident_memory_bytes to track target availability, query latency, and agent memory footprint, respectively. Key features include time-range analysis, alerting-ready panels, and per-target health indicators that help identify scrapes or targets with issues.
Screenshots
Get Dashboard✕
Download
Copy to Clipboard