Prometheus Network Exporter
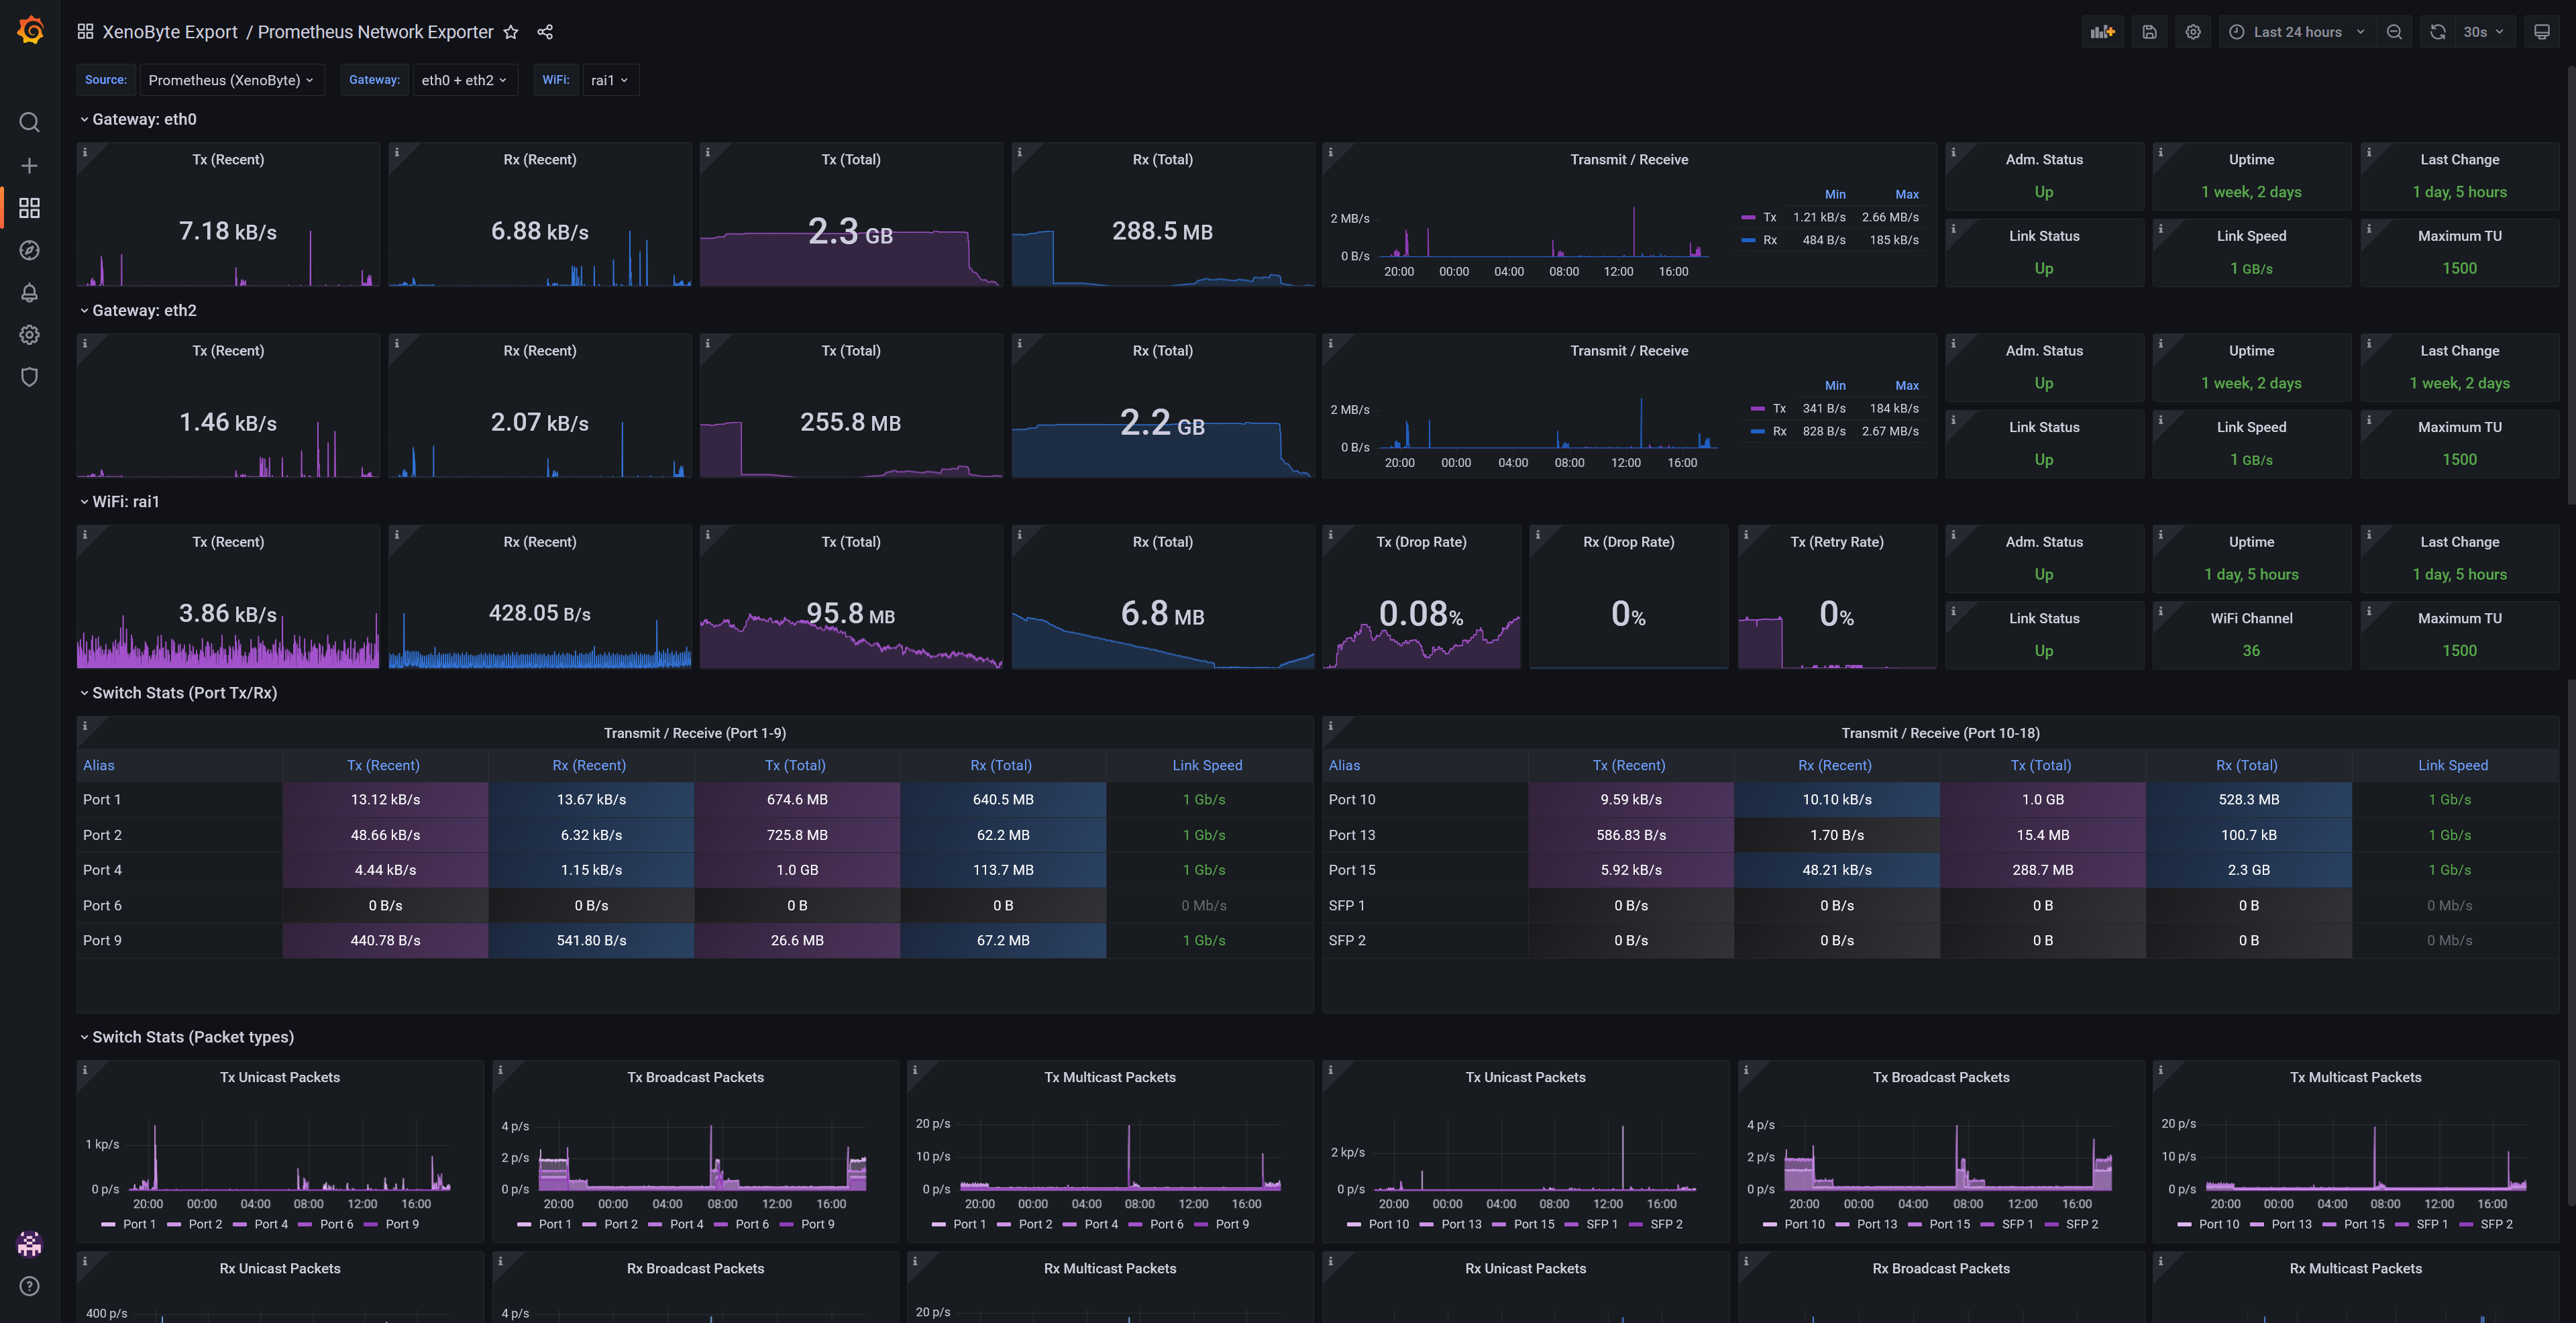
977

Created 11/22/2021
Updated 11/22/2021
Revision 4
Categories
Web Servers
Grafana Version >=8.2.5
Datasources
Prometheus

This dashboard gives an overview of Port/WiFi data for your Gateway and Access Points, including:

  • Transmit / Receive
  • Uptime
  • Link status and speed
  • Drop rate and retry (Unifi WiFi)

As well as detailed switch stats for each port, including Unicast, Broadcast and Multicast packets.

Uses Prometheus with the following exporters:

  • SNMP Exporter

With Grafana variables/constants, you can easily add:

  • More gateway and switch ports
  • More radios/Wifi networks
Get Dashboard
Download
Copy to Clipboard
Source Grafana.com

Used Metrics 22

  • ifHCOutOctets

  • ifHCInOctets

  • ifAdminStatus

  • sysUpTime

  • ifLastChange

  • ifOperStatus

  • ifHighSpeed

  • ifMtu

  • unifiVapTxDropped

  • unifiVapTxErrors

  • unifiVapTxPackets

  • unifiVapRxDropped

  • unifiVapRxErrors

  • unifiVapRxPackets

  • unifiVapTxRetries

  • unifiVapChannel

  • ifHCOutUcastPkts

  • ifHCOutBroadcastPkts

  • ifHCOutMulticastPkts

  • ifHCInUcastPkts

  • ifHCInBroadcastPkts

  • ifHCInMulticastPkts