Prometheus Metrics Management 10,75110,751
8/13/2023
5/14/2025
4
>=11.6.0
Prometheus
Description
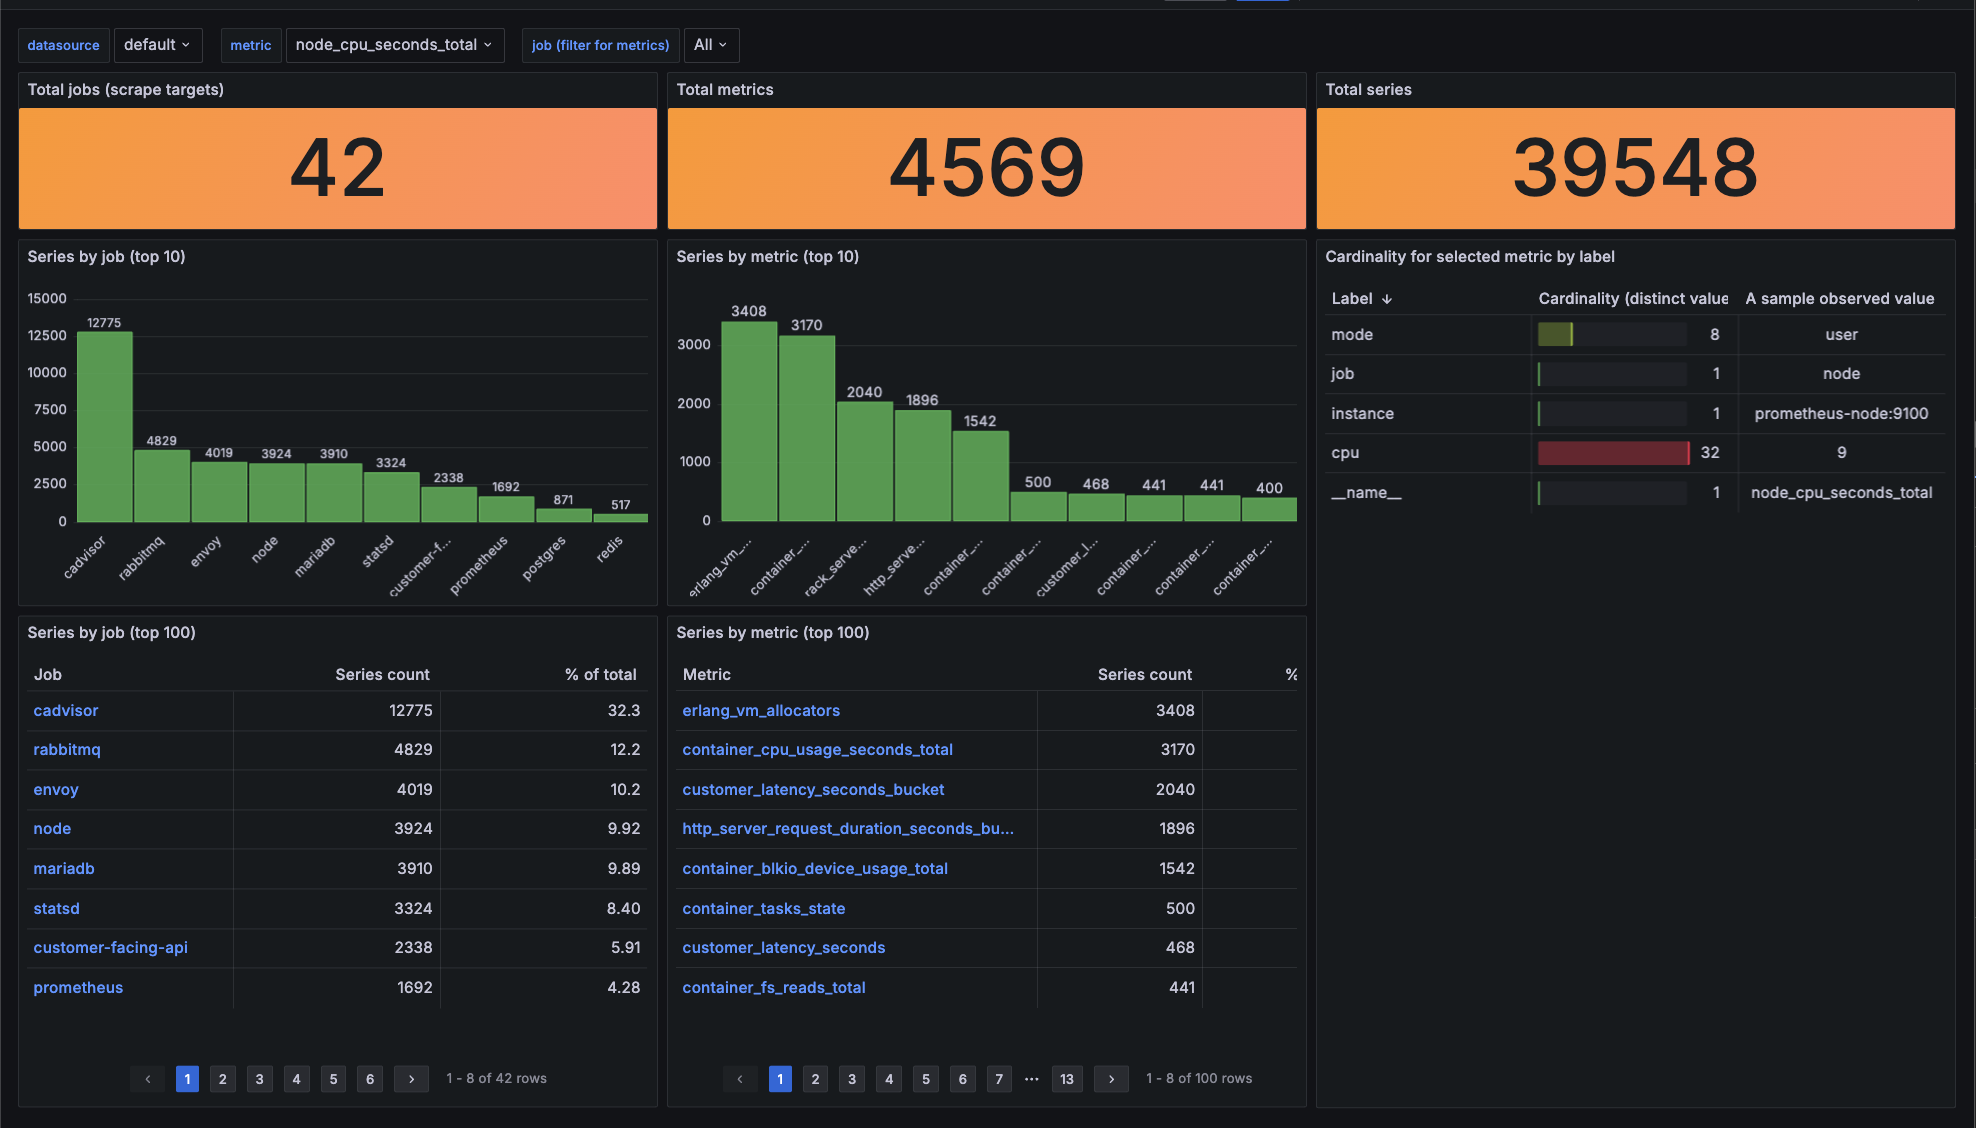
Inspect the cardinality of your Prometheus metrics
Screenshots
Used Metrics 22
metric
topk
Get Dashboard✕
Download
Copy to Clipboard