Prometheus Metrics (Designed for PMM) 1,9141,914 4.0 (1 reviews)
9/9/2018
1/18/2019
2
>=5.1.3
Prometheus
Description
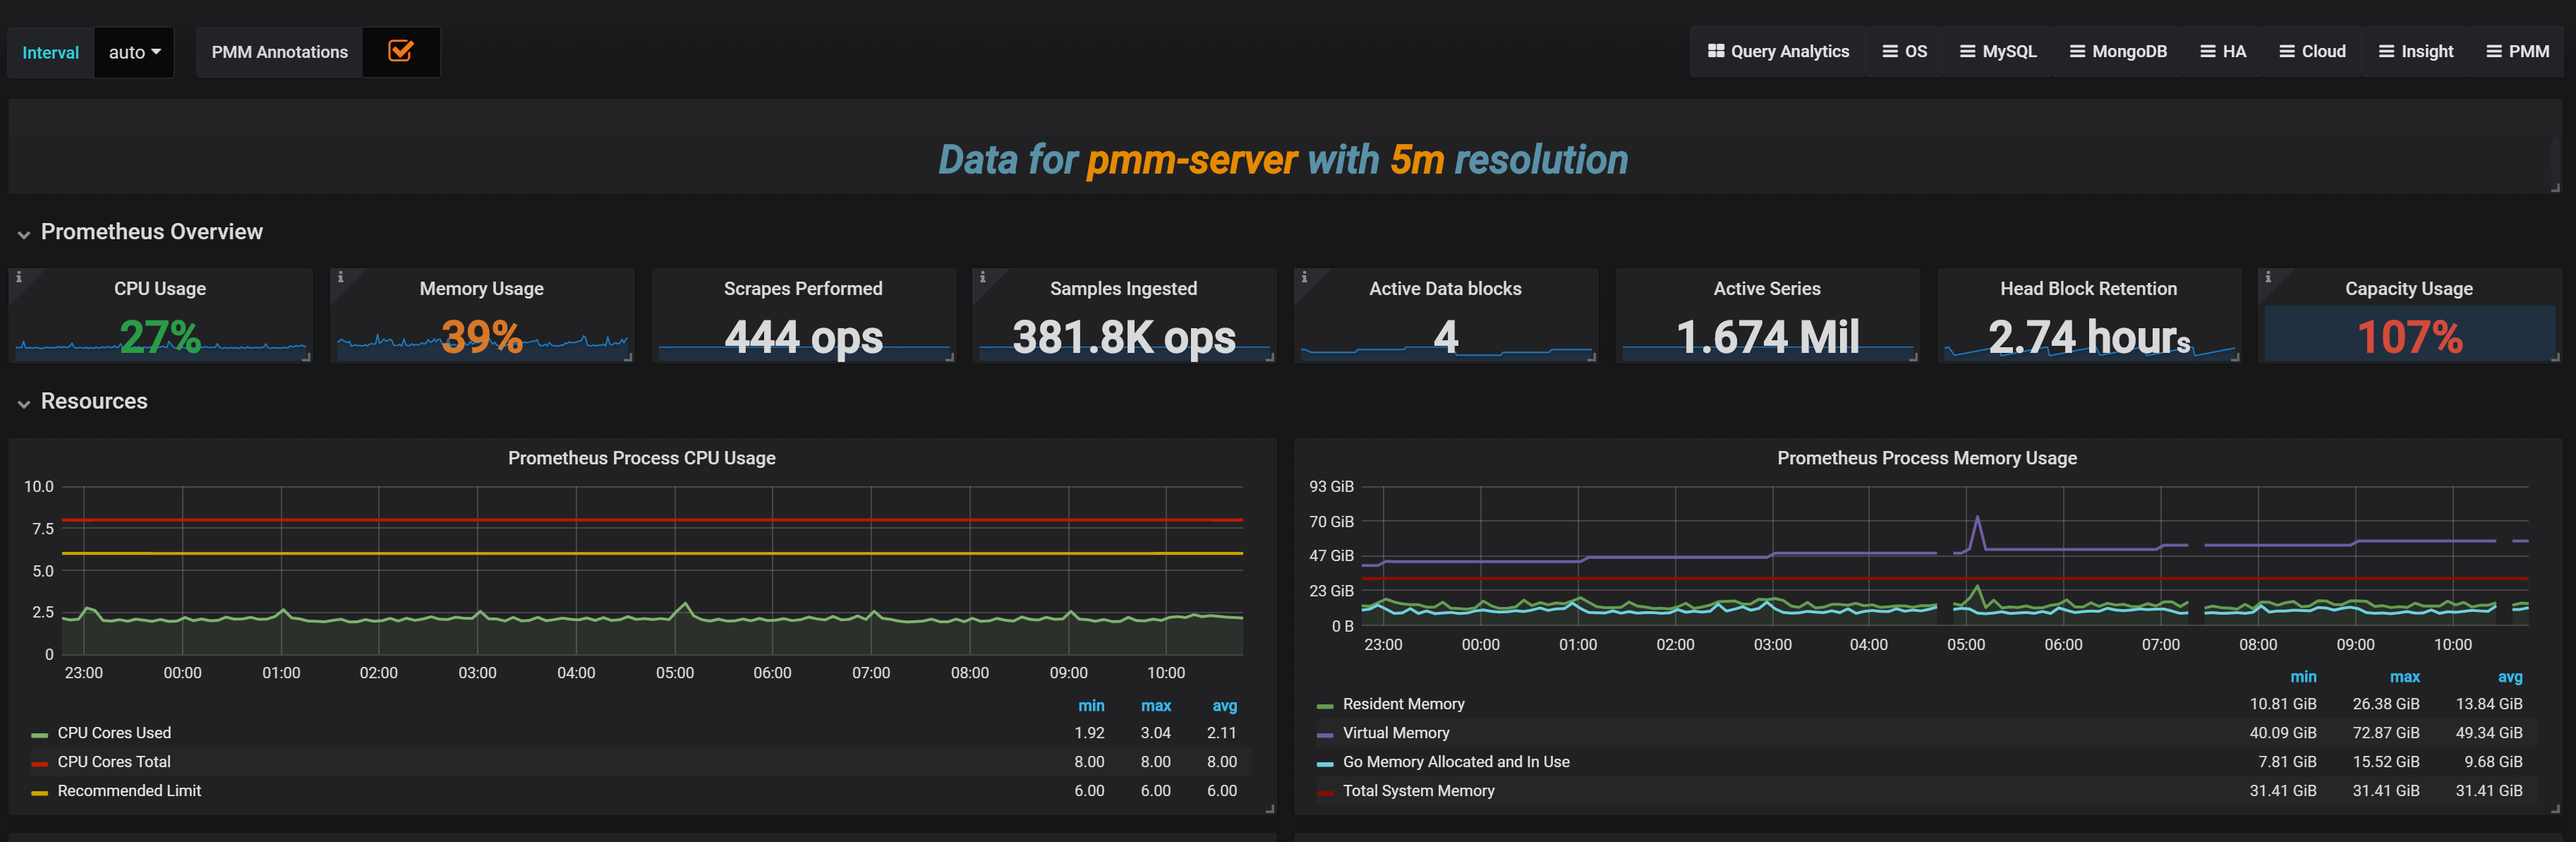
Dashboard with Prometheus Metrics. Part of Percona Monitoring and Management ( https://www.percona.com/software/database-tools/percona-monitoring-and-management )
Online version: https://pmmdemo.percona.com/graph/d/SK8vJ2Hiz/prometheus
Screenshots
Used Metrics 1212
-
go_memstats_alloc_bytes
-
go_memstats_stack_inuse_bytes
interval
node_cpu
node_memory_MemTotal
-
process_cpu_seconds_total
prometheus_target_interval_length_seconds_count
-
prometheus_tsdb_blocks_loaded
-
prometheus_tsdb_head_max_time
-
prometheus_tsdb_head_min_time
-
prometheus_tsdb_head_samples_appended_total
-
prometheus_tsdb_head_series
Get Dashboard✕
Download
Copy to Clipboard