Prometheus memcached 16,94716,947
6/22/2016
6/27/2016
1
>=3.1.0
Prometheus
Description
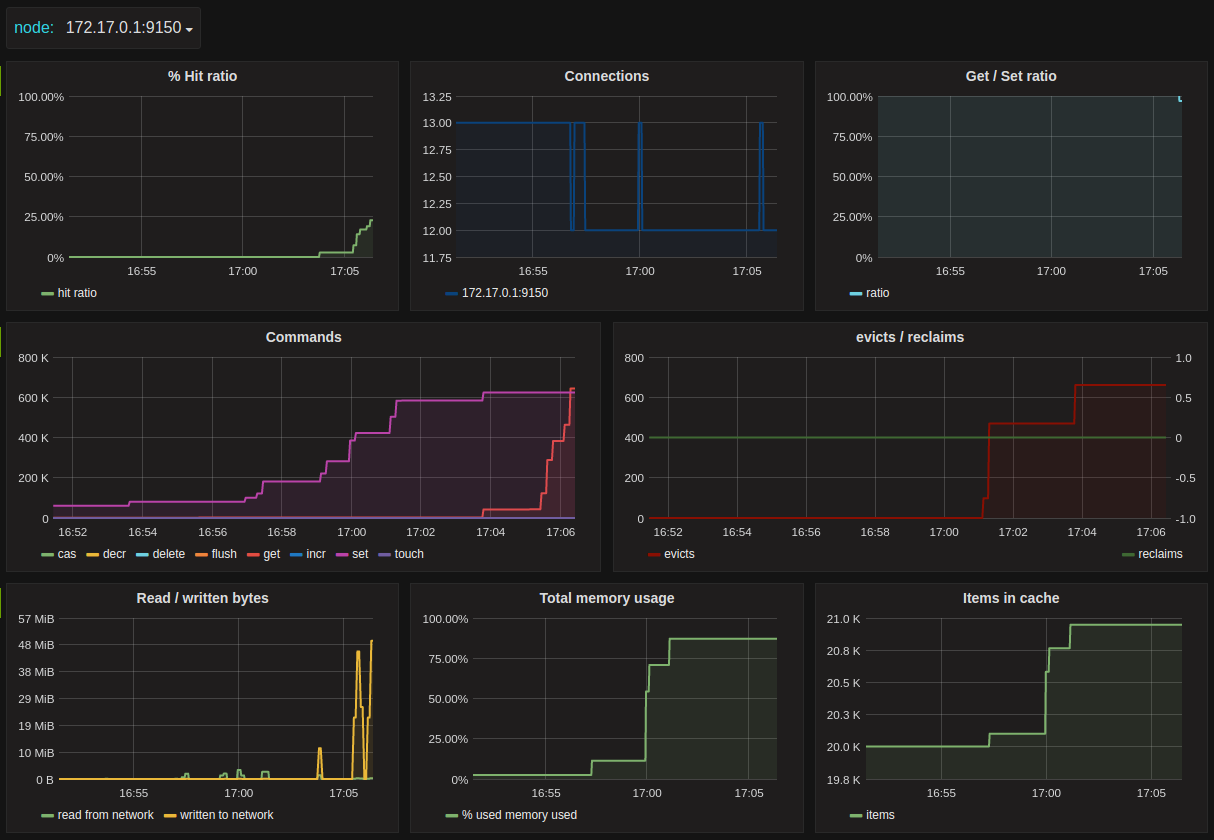
Prometheus dashboard for memcached servers
Screenshots
Get Dashboard✕
Download
Copy to Clipboard
Prometheus dashboard for memcached servers