Prometheus JMX exporter for Kubernetes 1,8491,849
6/2/2020
6/28/2021
2
>=8.0.3
Prometheus
Description
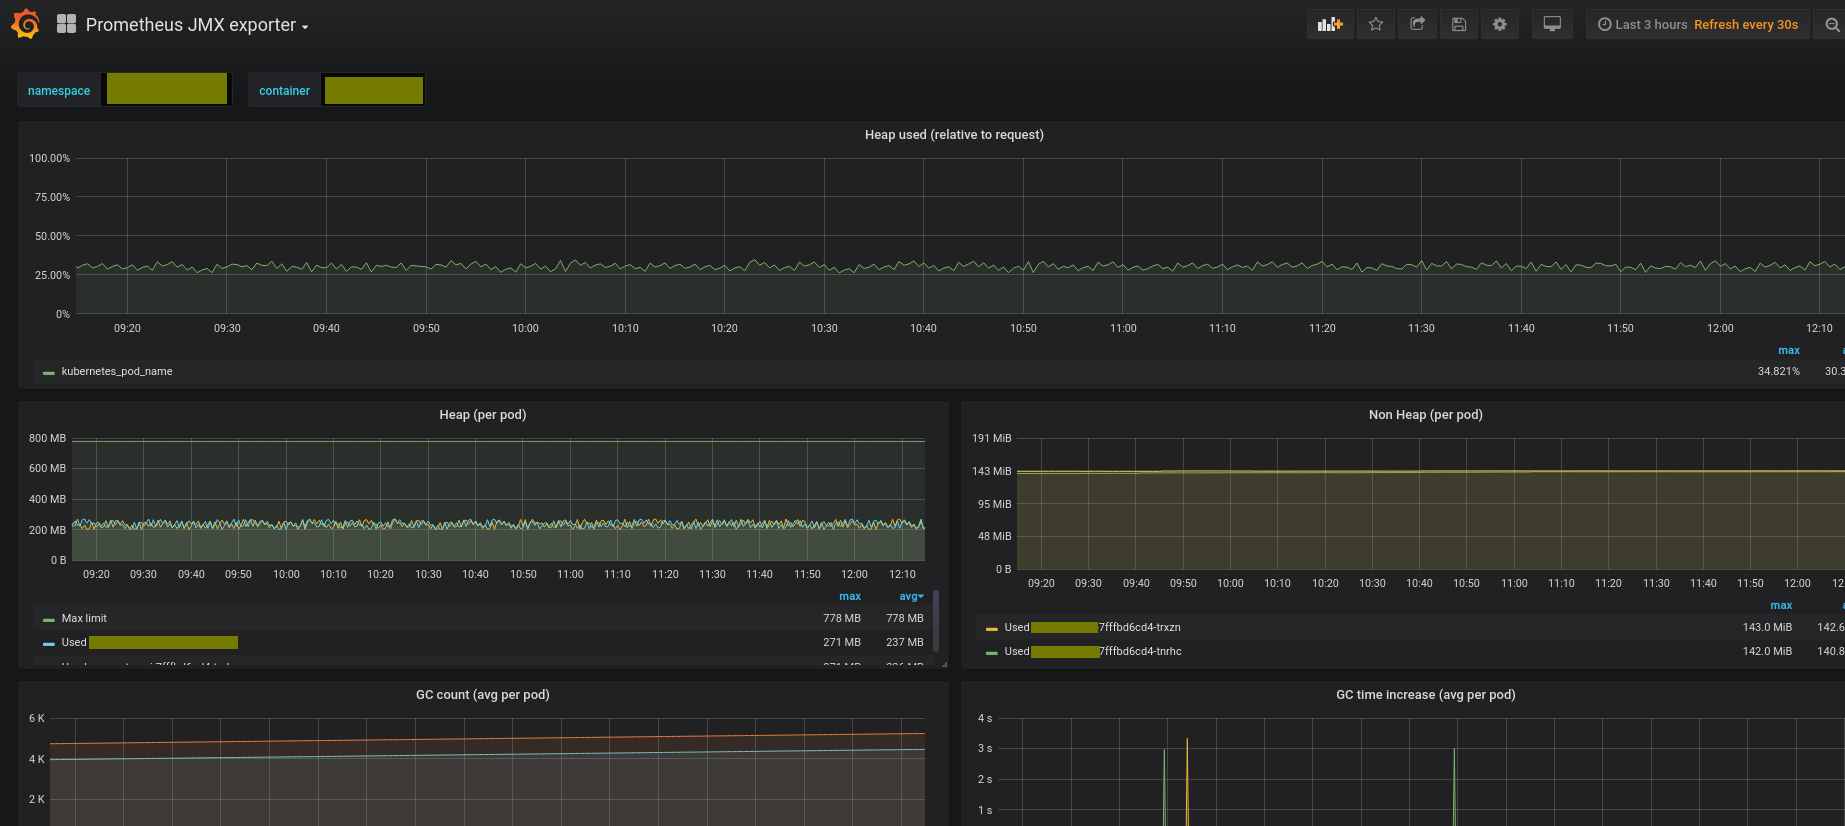
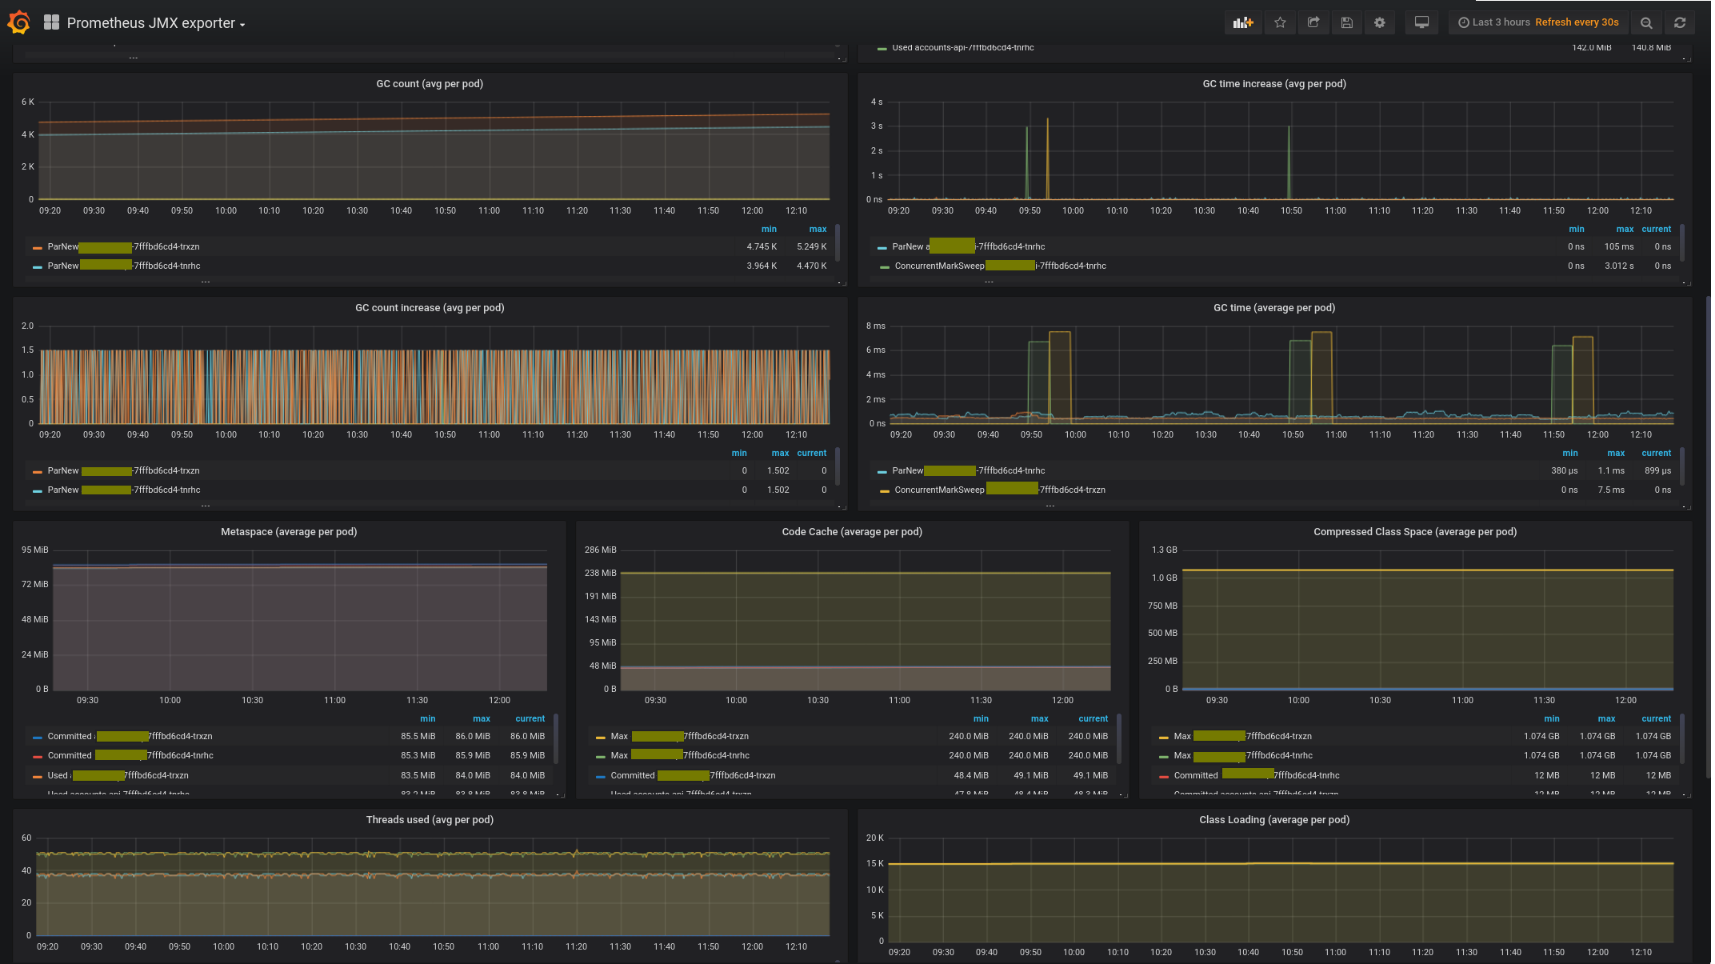
After selecting your namespace and container you get a wealth of JVM based metrics
Screenshots
Used Metrics 1111
jvm_classes_loaded
jvm_gc_collection_seconds_count
jvm_gc_collection_seconds_sum
jvm_memory_bytes_max
jvm_memory_bytes_used
jvm_memory_pool_bytes_committed
jvm_memory_pool_bytes_max
jvm_memory_pool_bytes_used
jvm_threads_current
jvm_threads_daemon
jvm_threads_deadlocked
Get Dashboard✕
Download
Copy to Clipboard