Prometheus Blackbox Exporter 194,451194,451 4.5 (4 reviews)
8/26/2021
2/8/2025
6
Web Servers
>=8.1.0
Prometheus
Description
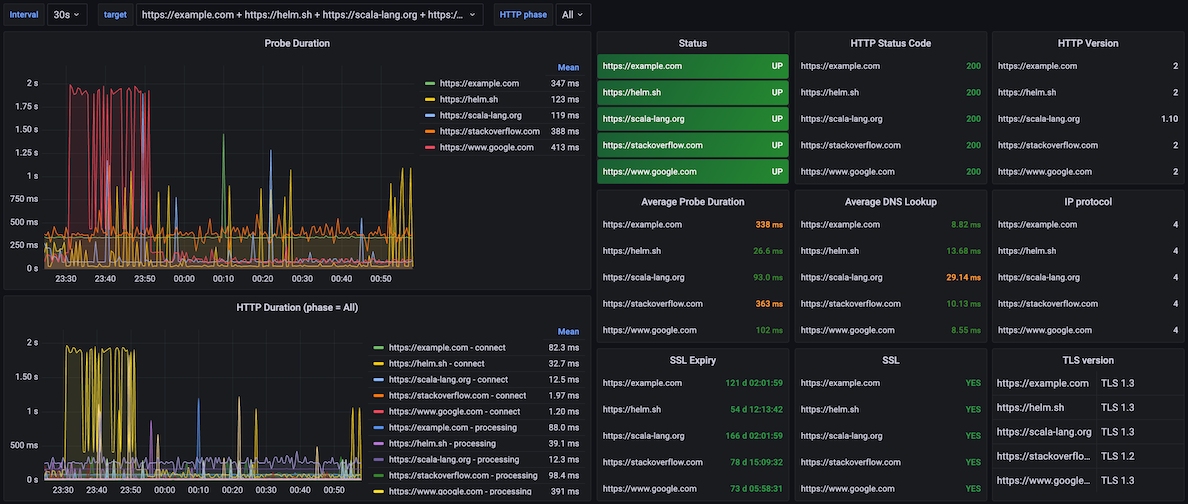
This dashboard monitors end-to-end health and performance of HTTP endpoints via the Blackbox Exporter, aggregating probe results into metrics such as probe_http_status_code, probe_success, and probe_duration_seconds to show availability, latency, and reliability. Key features include customizable panels for HTTP status, status line, DNS lookup time, and SSL/TLS details (e.g., probe_http_duration_seconds, probe_dns_lookup_time_seconds, probe_ssl_earliest_cert_expiry), plus phase-based and summary views like Average Probe Duration and TLS version information to diagnose slow or failing endpoints.
Screenshots
Get Dashboard✕
Download
Copy to Clipboard