Prometheus Alerts 80,21280,212
11/5/2019
11/8/2019
1
>=6.4.2
Prometheus
Description
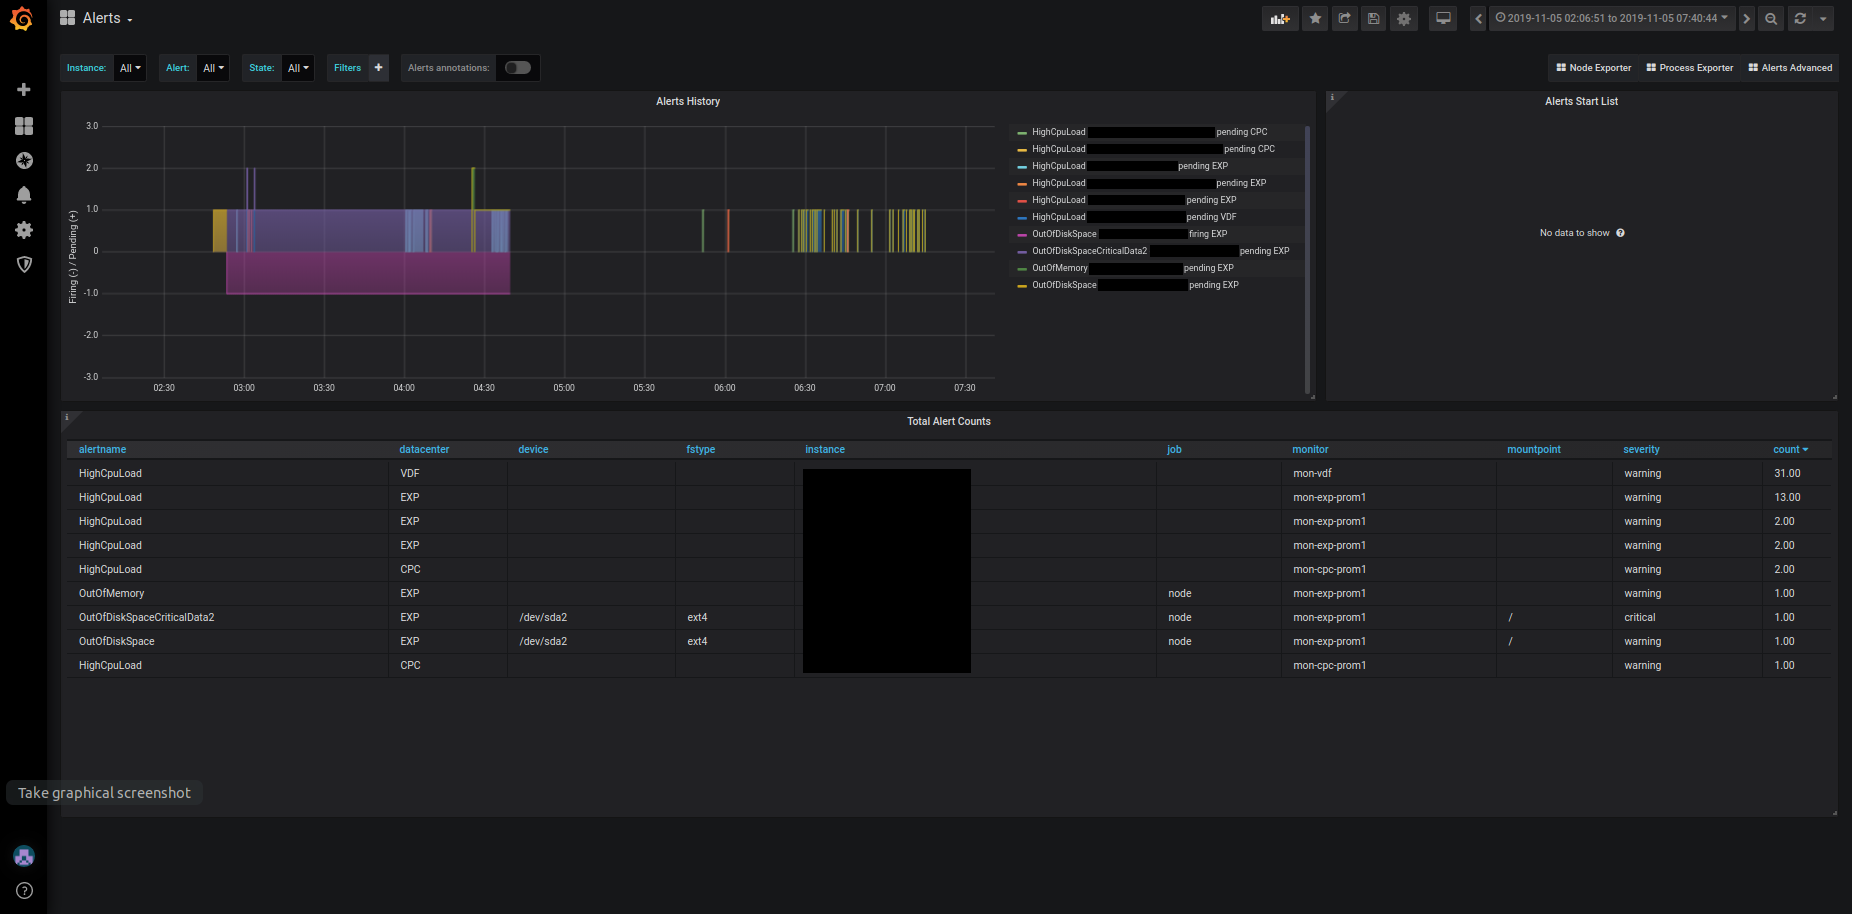
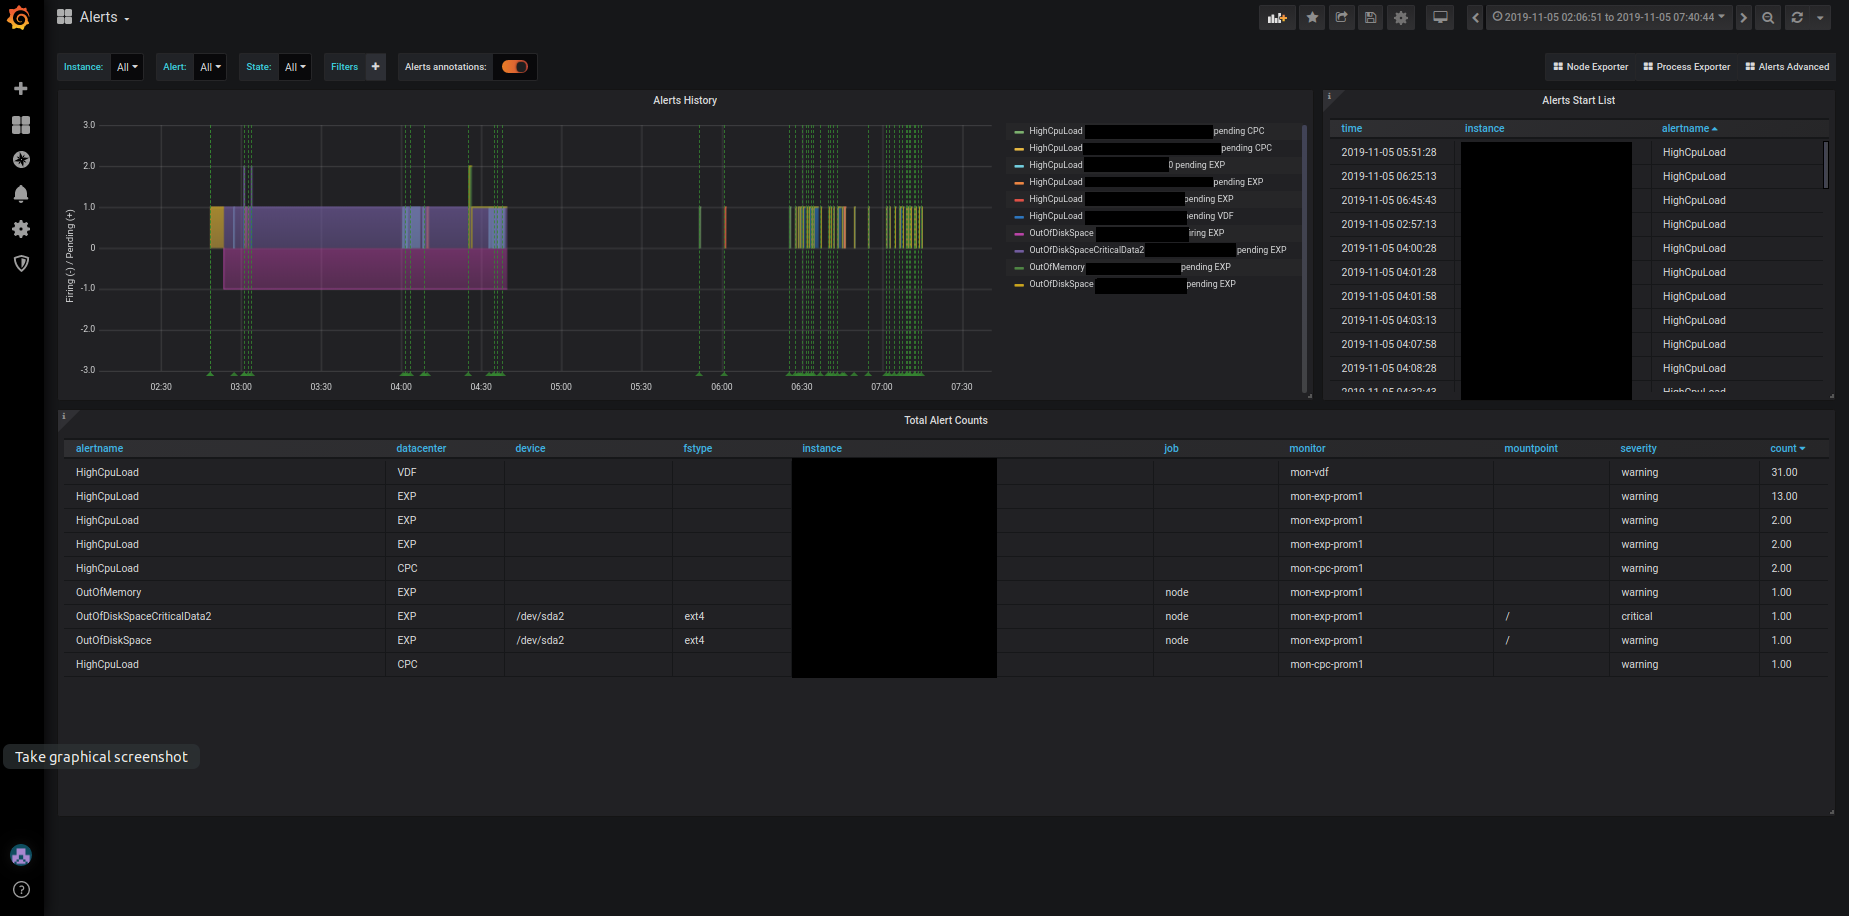
Monitors active and historical Prometheus alerts by aggregating alert states and timelines. Key features include an Alerts History panel for trend analysis, an Alerts Start List to track when alerts fire, and overall Total Alert Counts to gauge alert volume. Metrics such as ALERTS, ALERTS_FOR_STATE, and related counters are used to compute state transitions and counts for quick operational visibility.
Screenshots
Used Metrics 22
ALERTS
ALERTS_FOR_STATE
Get Dashboard✕
Download
Copy to Clipboard