Prometheus 2.0 Overview 5,860,3365,860,336 5.0 (2 reviews)
11/9/2017
12/23/2020
2
>=4.5.0-beta1
Prometheus
Description
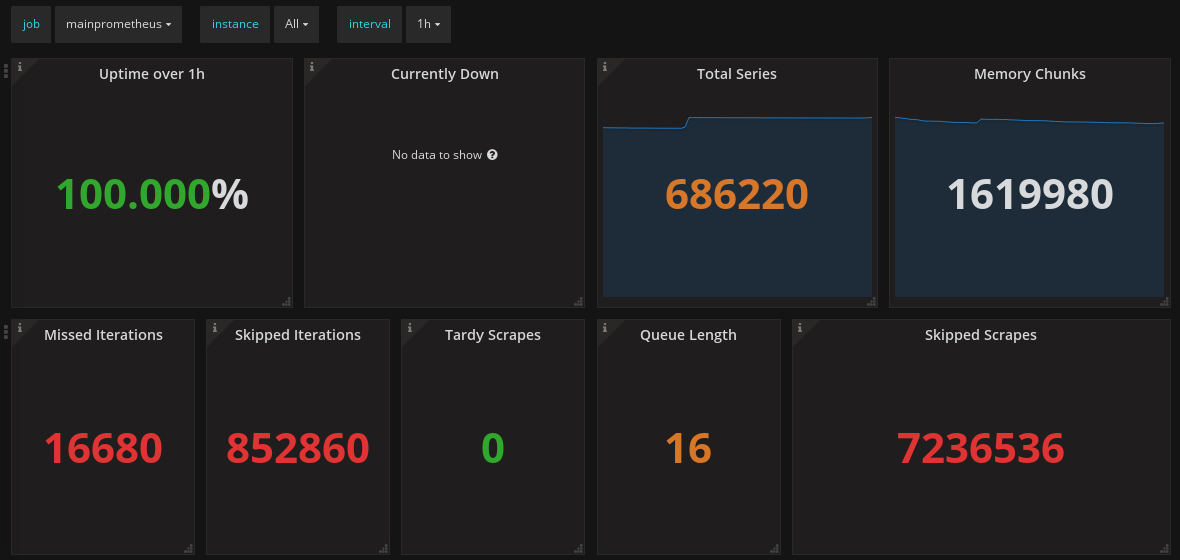
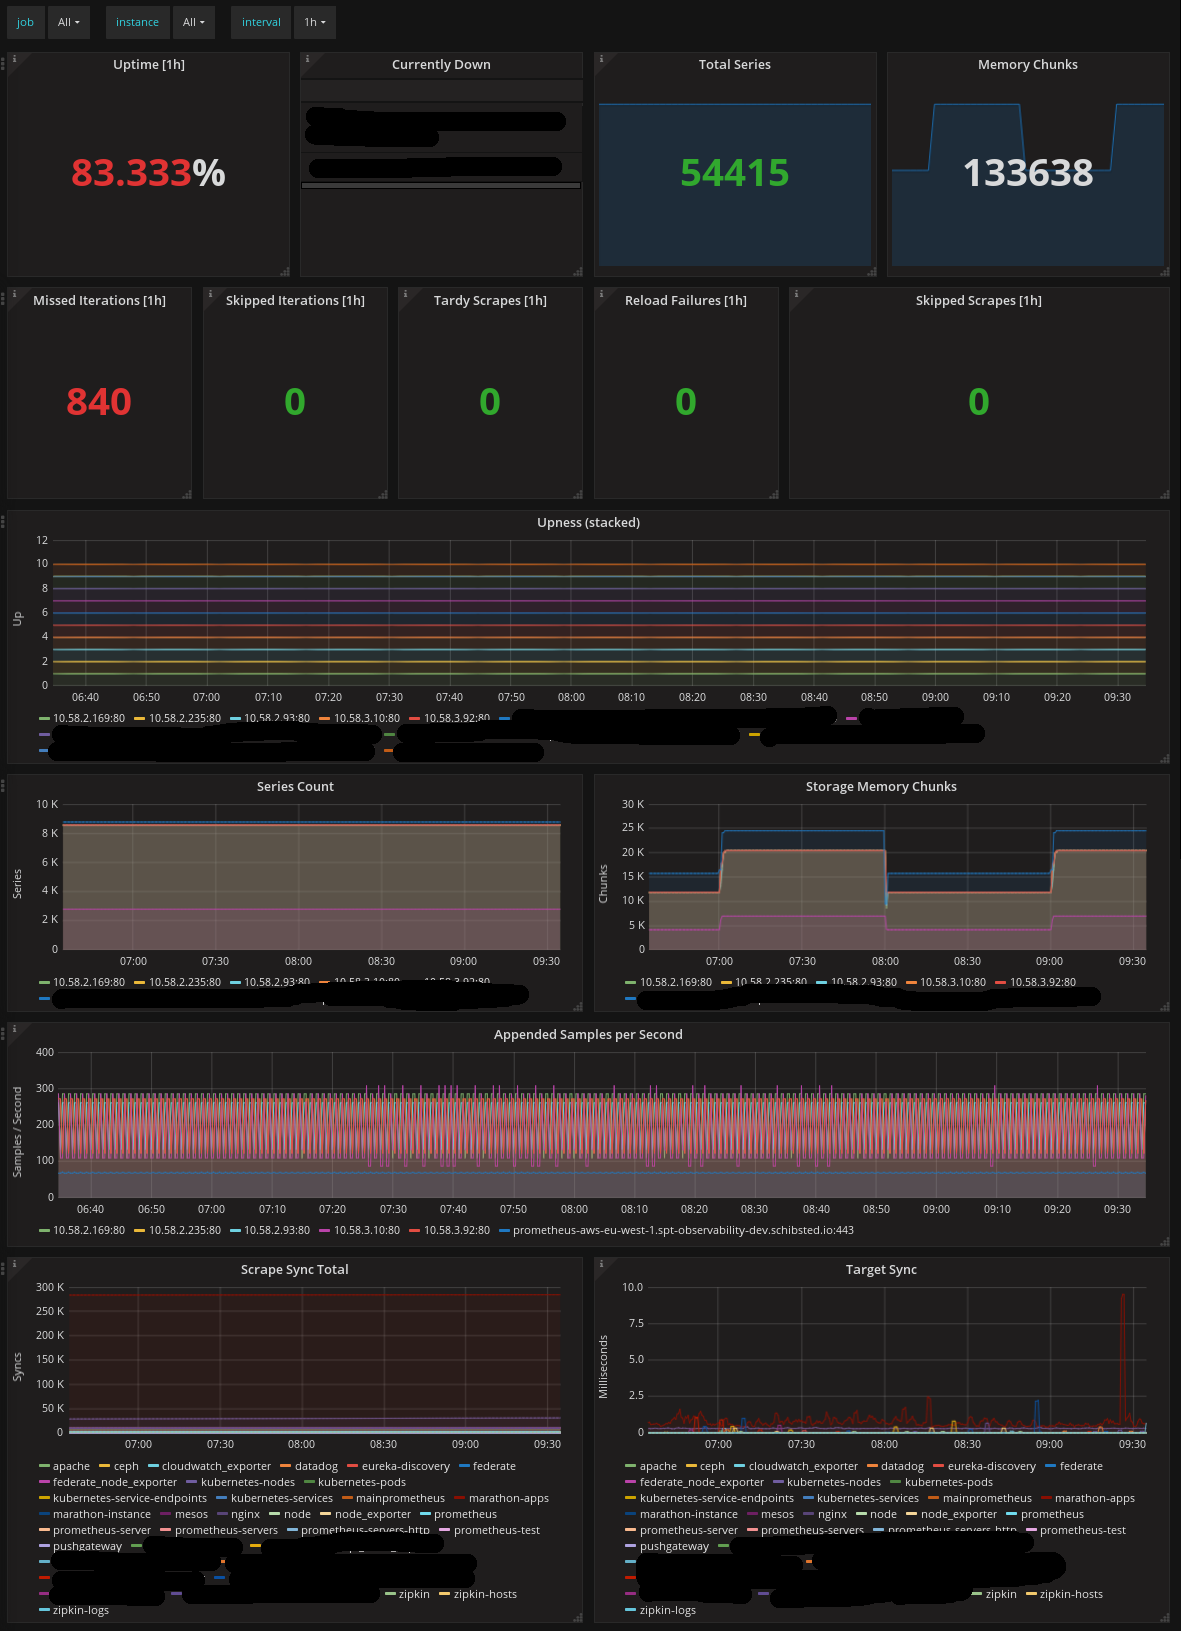
This dashboard provides a technical snapshot of Prometheus-based performance and reliability metrics, focusing on resource usage, query health, and data ingestion. It highlights essential panels such as CPU and memory utilization to track node health, query latency and error rate to monitor Prometheus data paths, and data ingestion throughput to ensure scrapes and remote writes stay within capacity. Key metrics include instance:node_cpu_seconds_total:rate10m, node_memory_bytes{type="available"}, and prometheus_rule_evaluation_duration_seconds to surface latency and operational stability.
Screenshots
Get Dashboard✕
Download
Copy to Clipboard