Prometheus 1,742,5611,742,561
Description
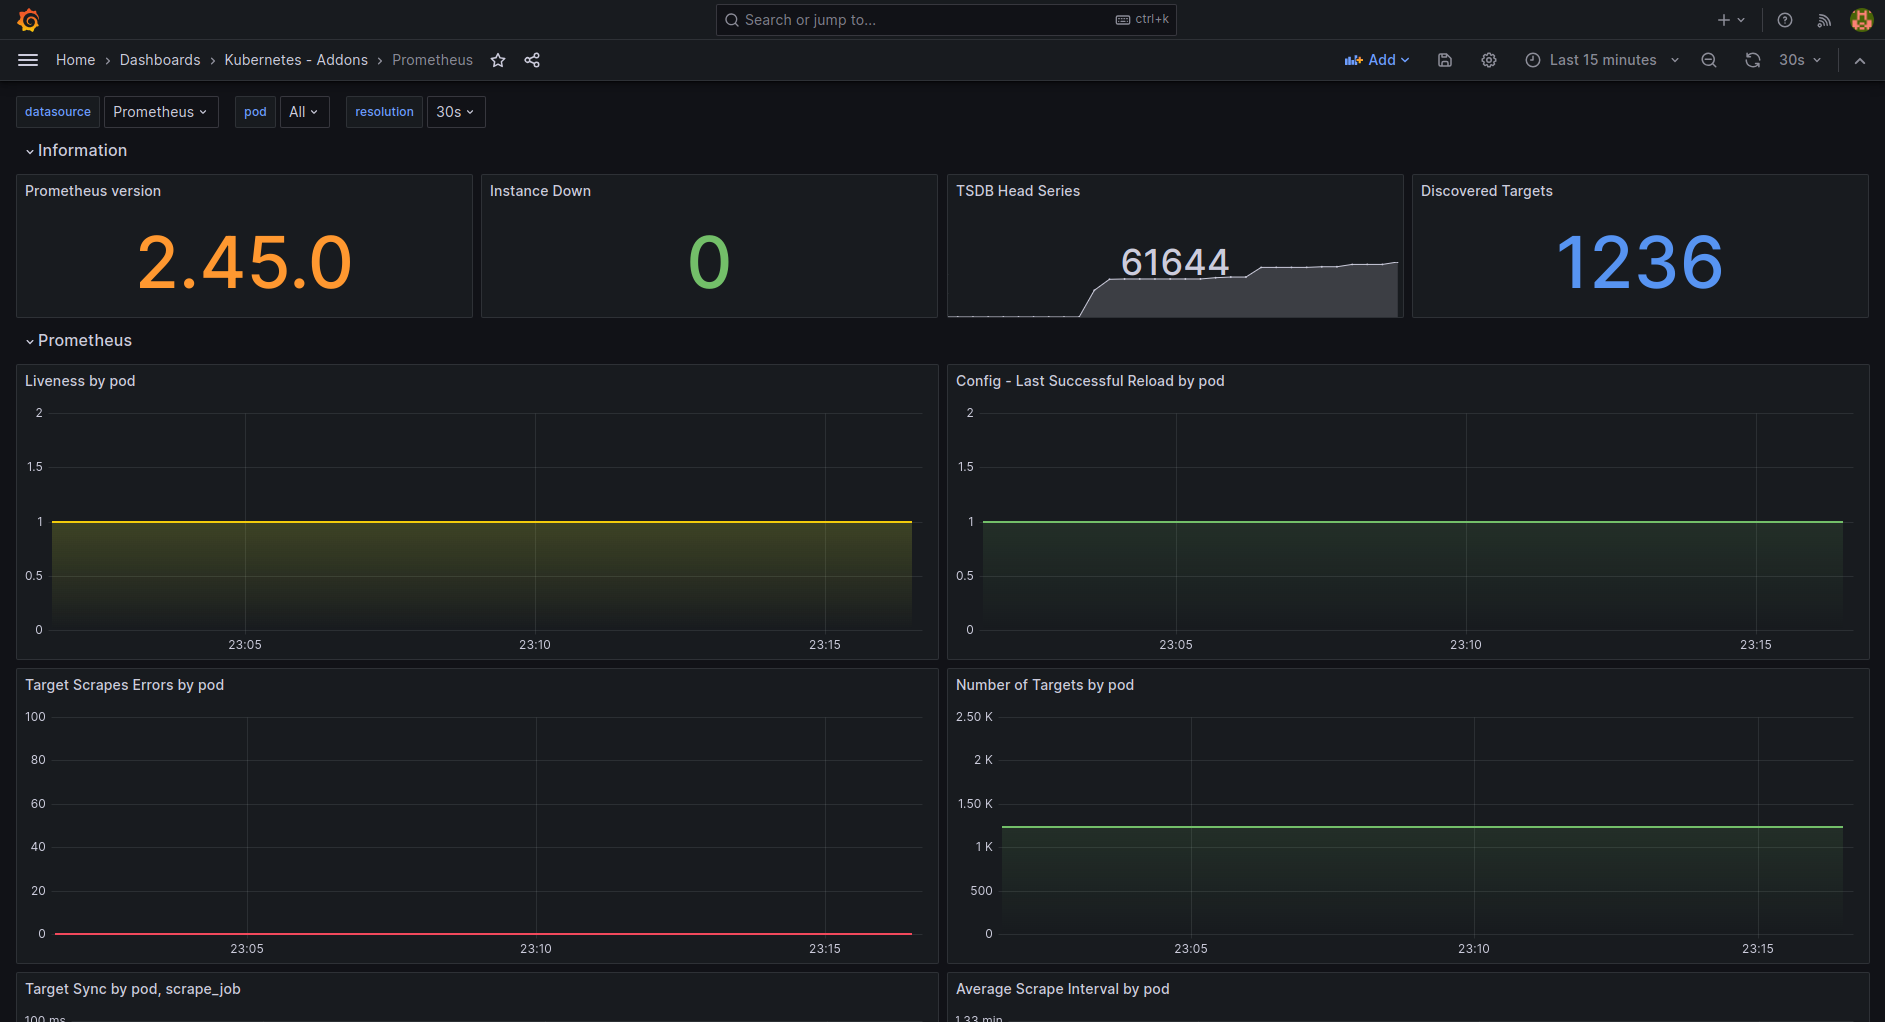
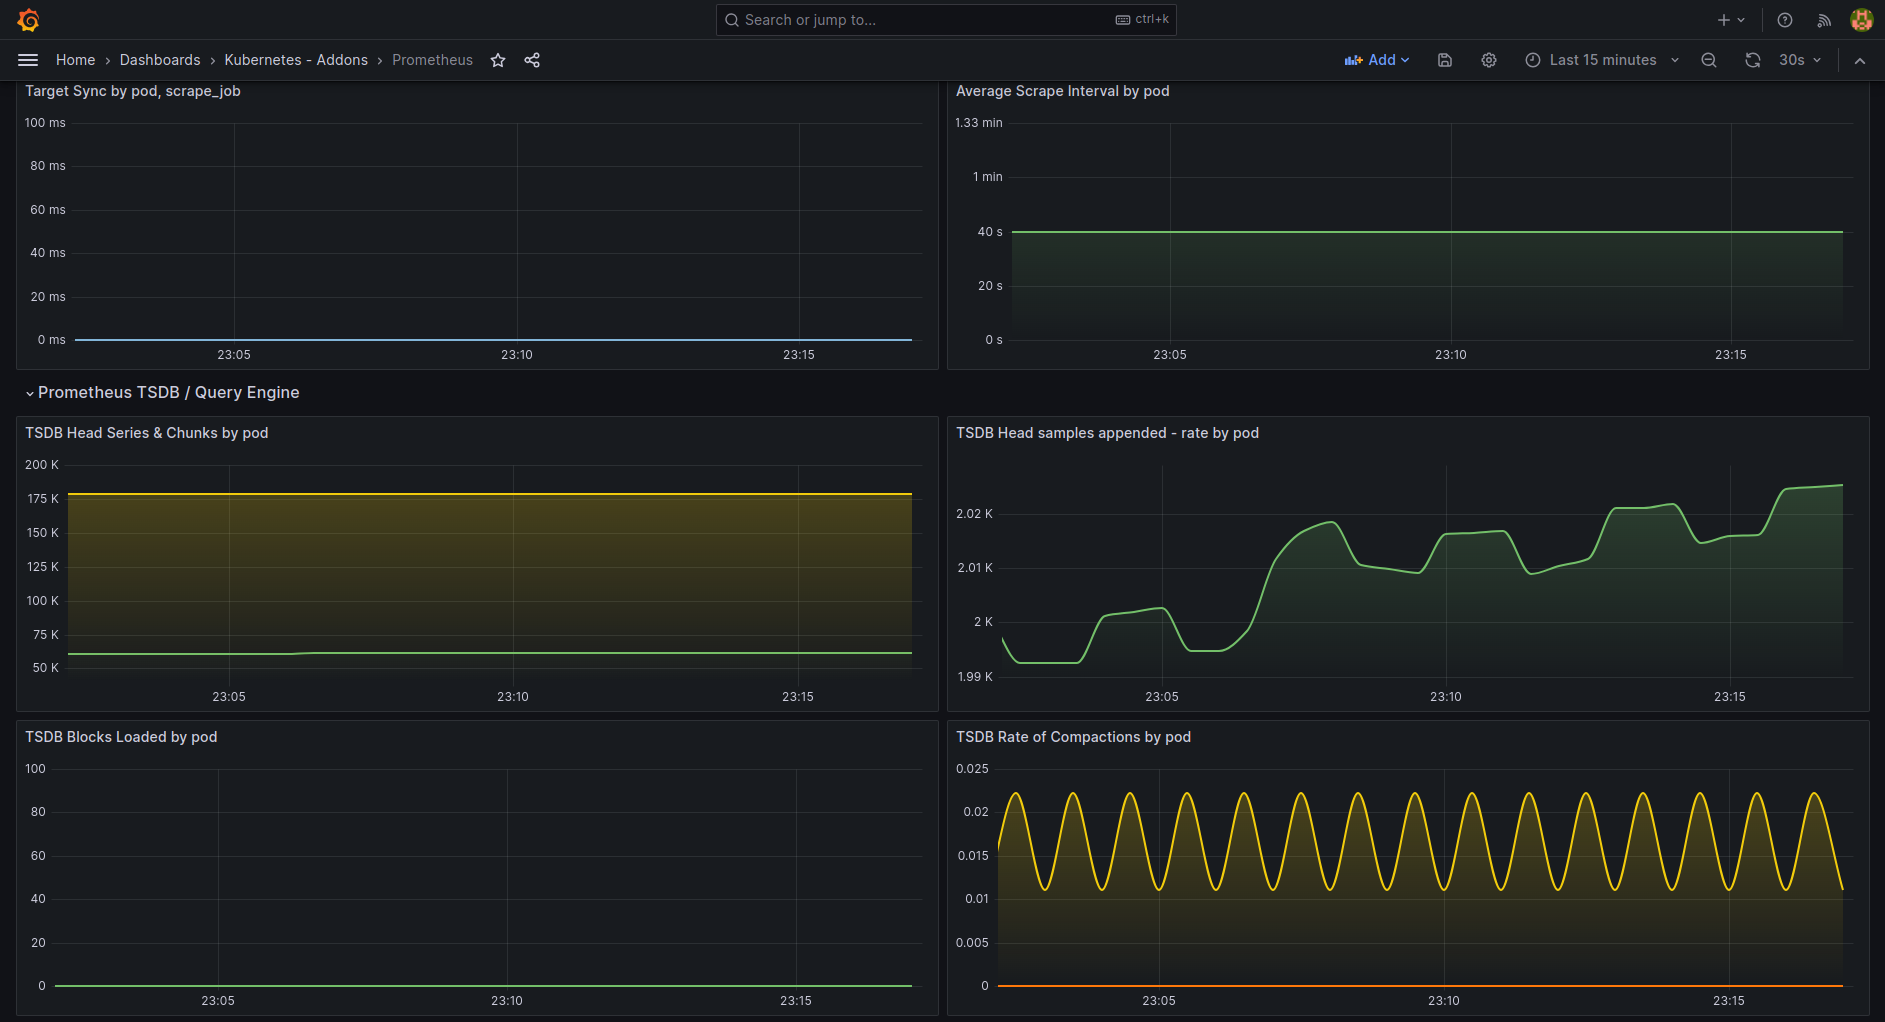
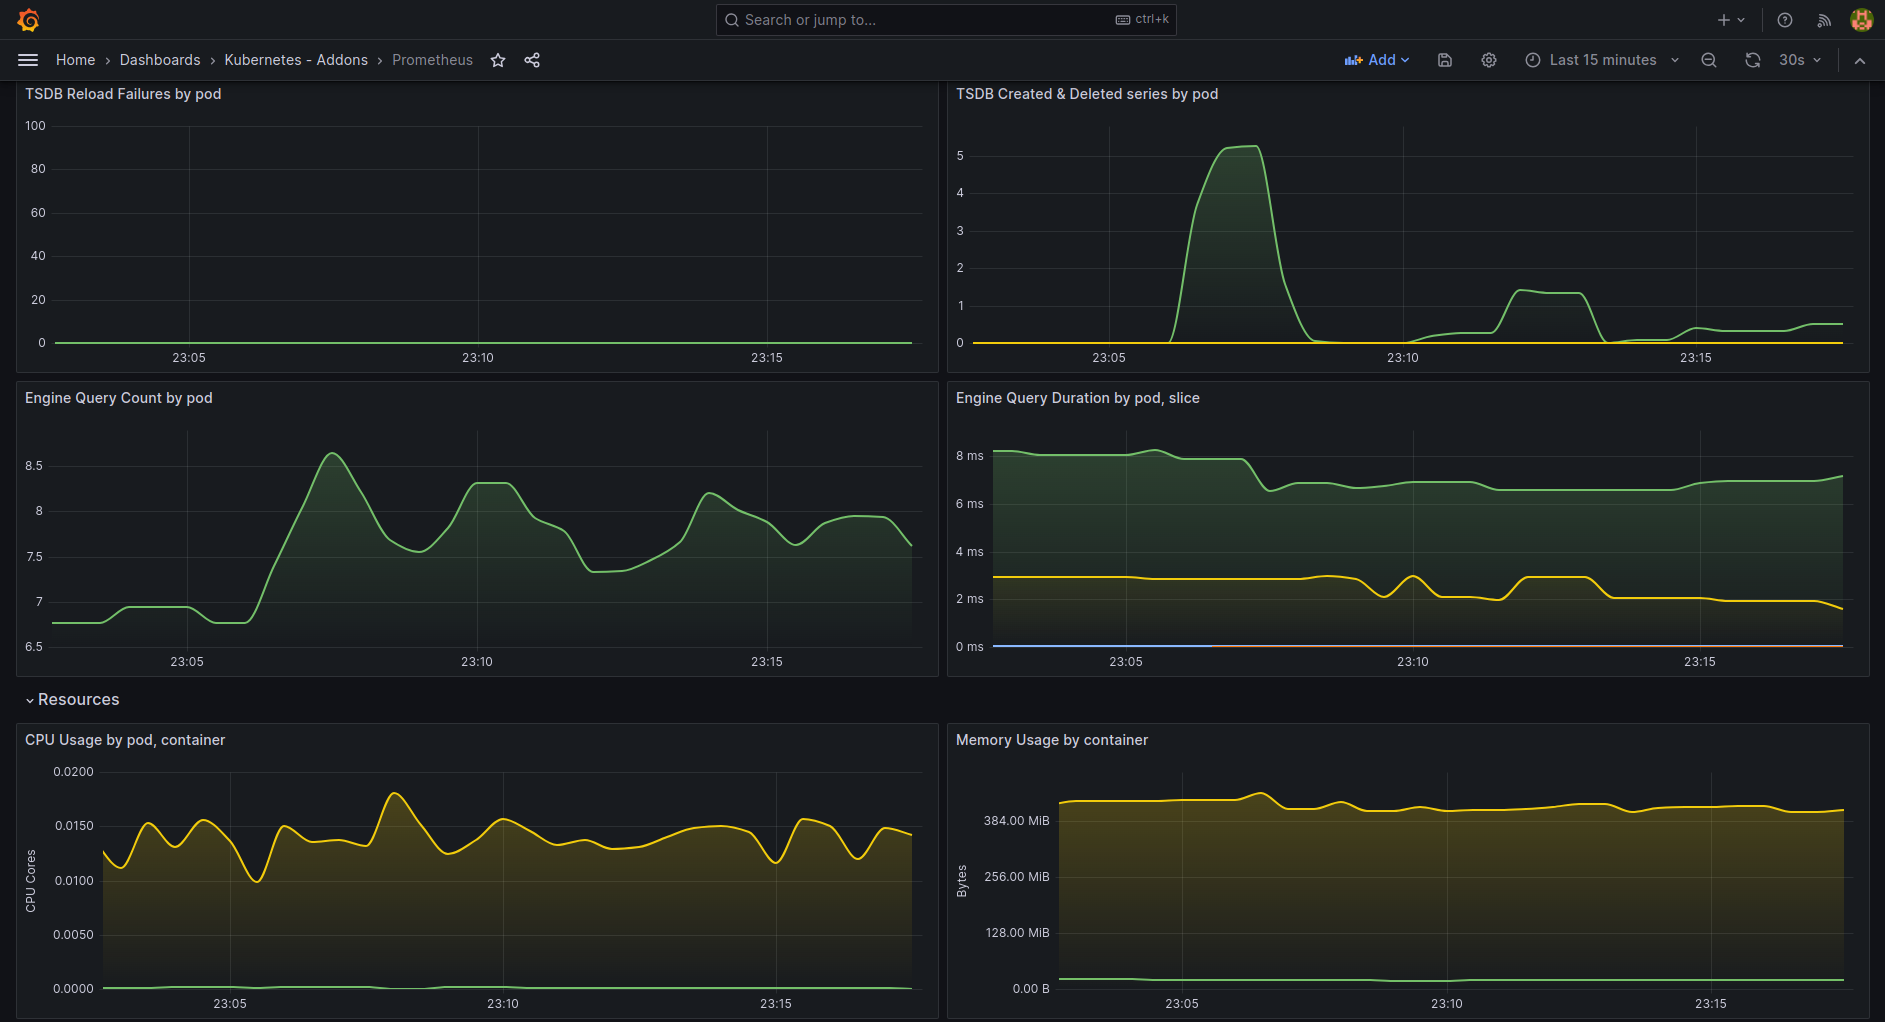
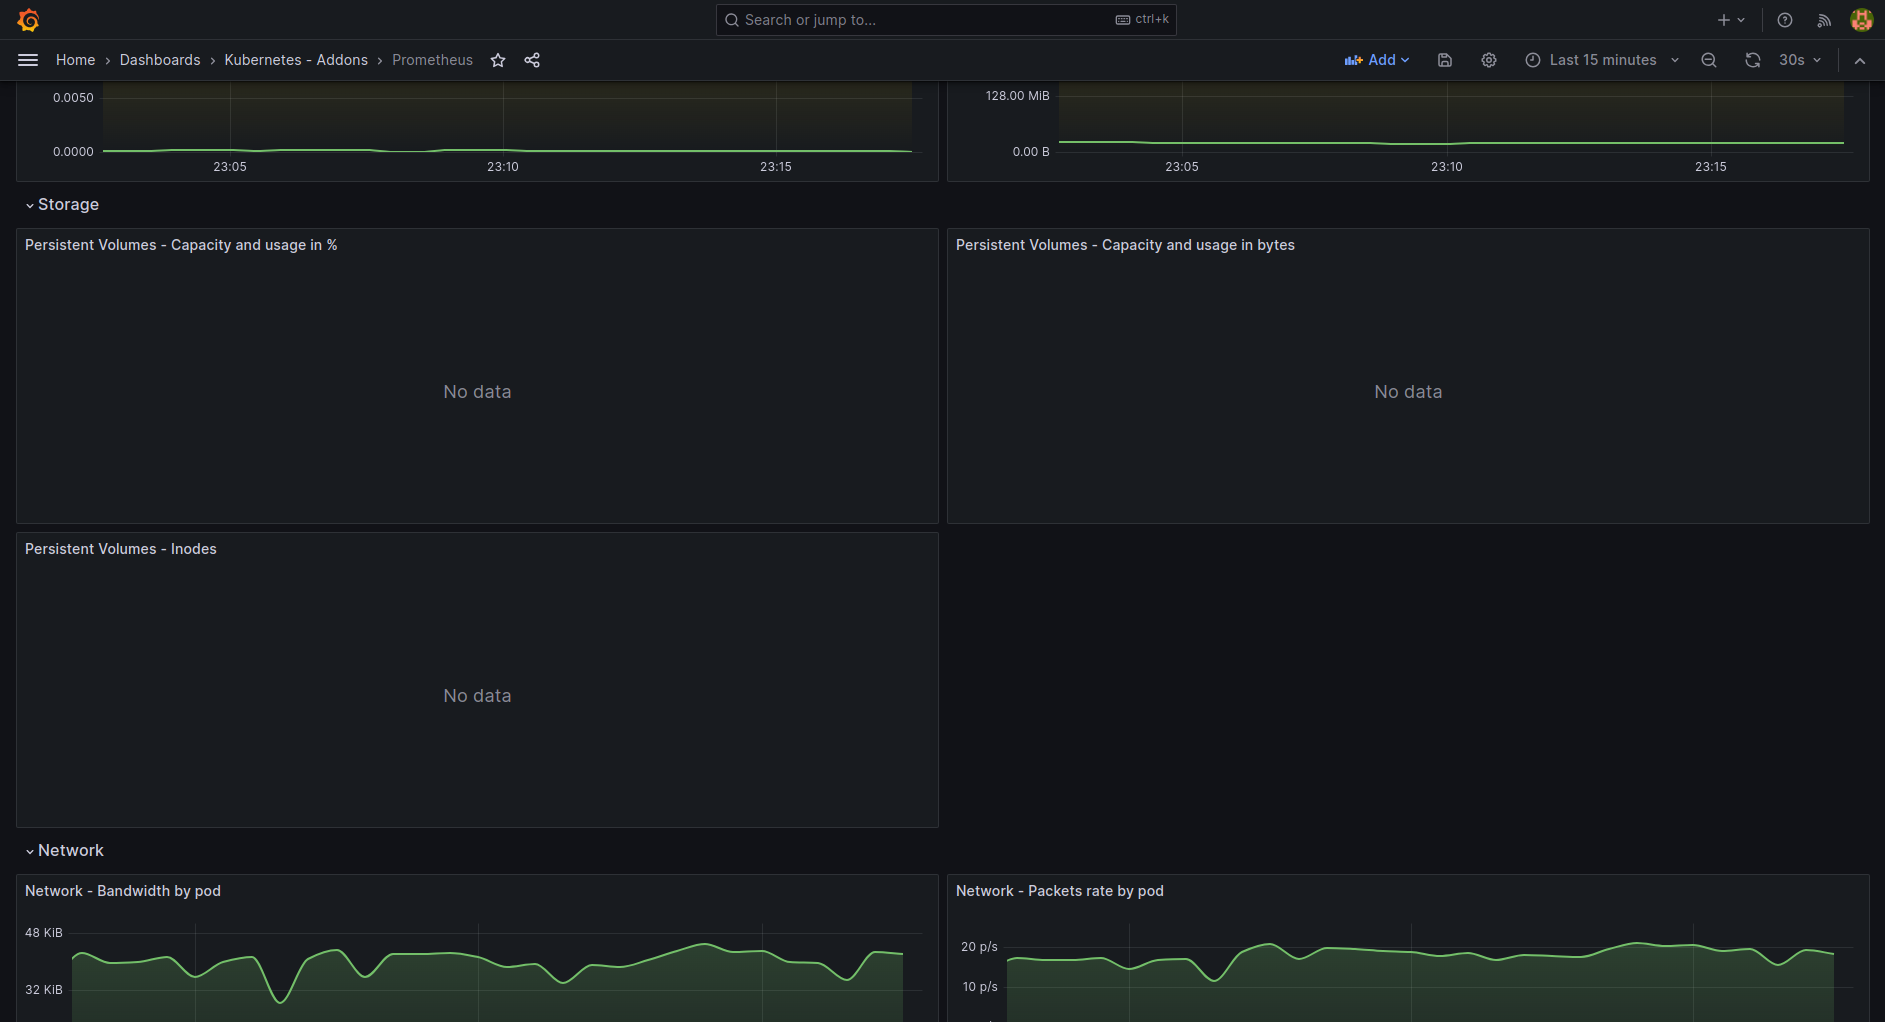
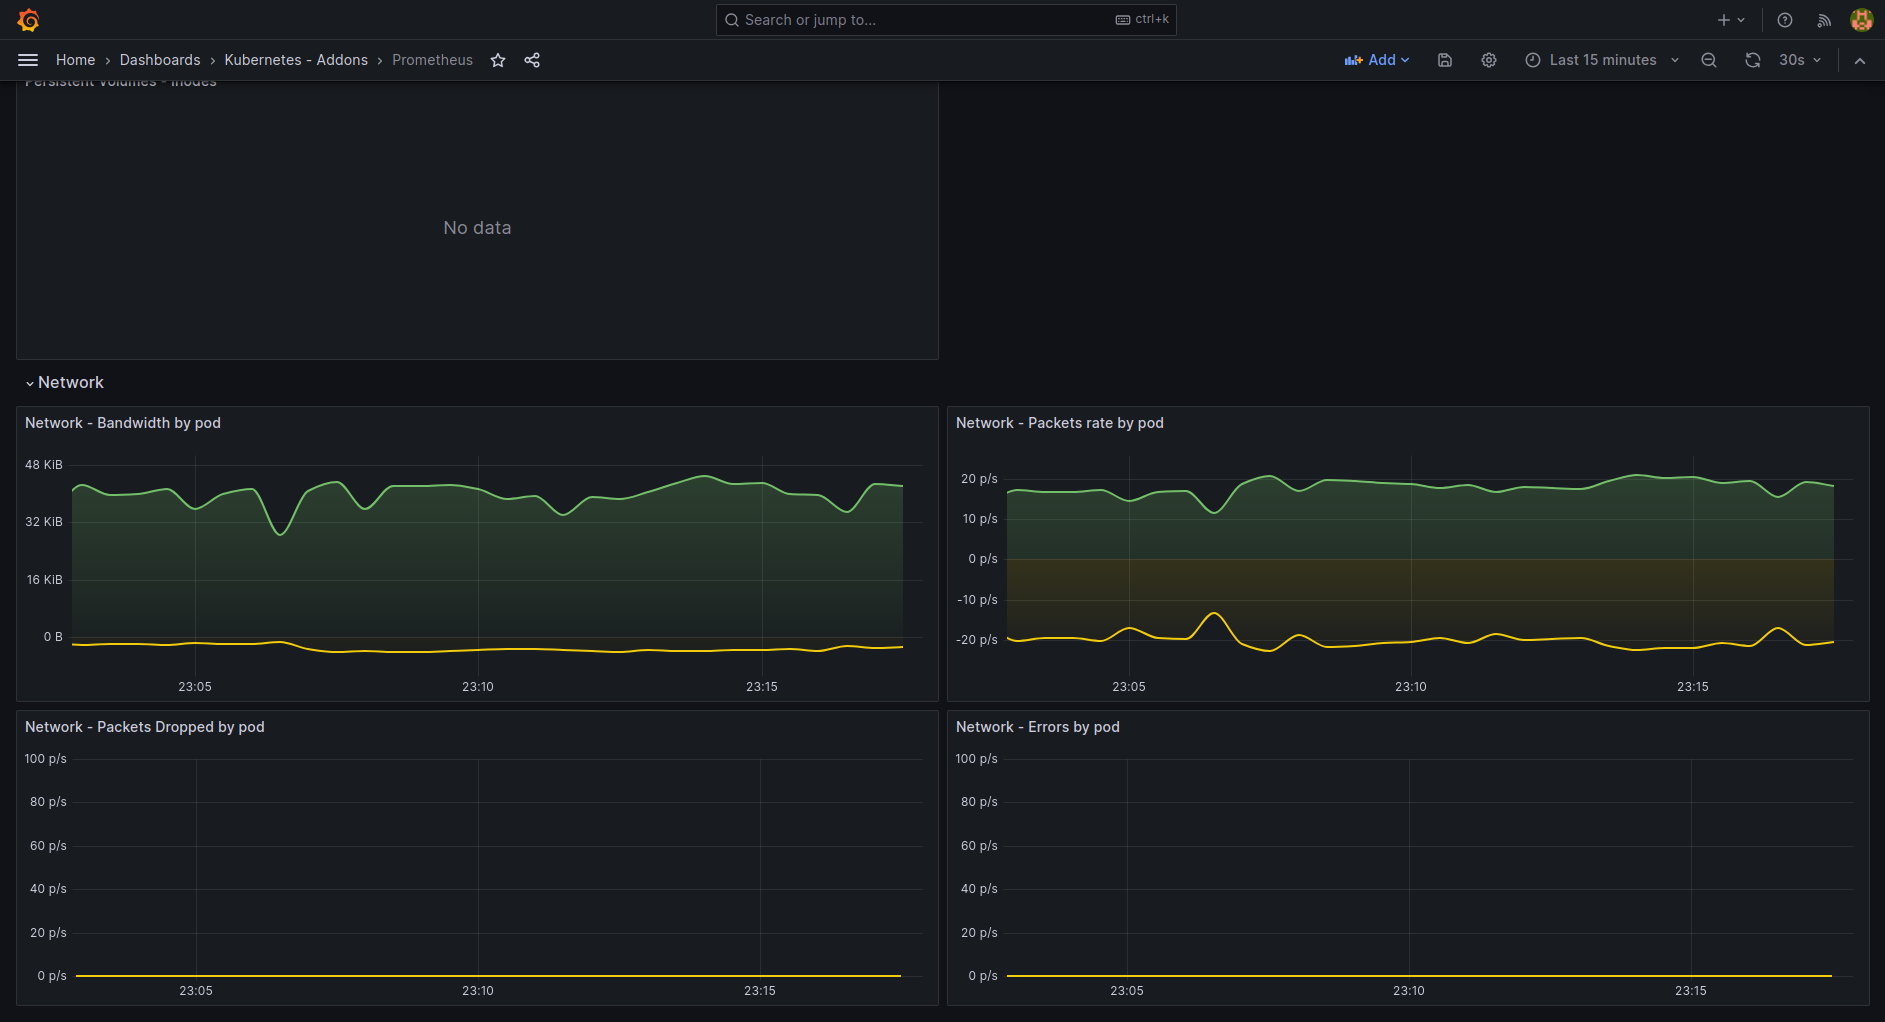
This dashboard provides a comprehensive view of a Prometheus deployment, monitoring both its internal health and the status of scraped targets across pods. It highlights operational health through up and prometheus_build_info while tracking configuration and discovery status via prometheus_config_last_reload_successful and prometheus_sd_discovered_targets, and surfaces scrape reliability and TSDB health with metrics like prometheus_target_scrapes_exceeded_body_size_limit_total and prometheus_tsdb_head_series. Key panels include per-pod visibility for scrape activity, TSDB metrics, and target discovery, enabling rapid pinpointing of issues such as config reload failures, target scrapes errors, and TSDB head growth or load indicators.
Screenshots

Used Metrics 3939
-
container_cpu_usage_seconds_total
-
container_memory_working_set_bytes
-
container_network_receive_bytes_total
-
container_network_receive_errors_total
-
container_network_receive_packets_dropped_total
-
container_network_receive_packets_total
-
container_network_transmit_bytes_total
-
container_network_transmit_errors_total
-
container_network_transmit_packets_dropped_total
-
container_network_transmit_packets_total
kubelet_volume_stats_capacity_bytes
kubelet_volume_stats_inodes
kubelet_volume_stats_inodes_used
kubelet_volume_stats_used_bytes
-
prometheus_build_info
-
prometheus_config_last_reload_successful
-
prometheus_engine_query_duration_seconds
prometheus_engine_query_duration_seconds_count
-
prometheus_sd_discovered_targets
prometheus_target_interval_length_seconds_count
prometheus_target_interval_length_seconds_sum
-
prometheus_target_scrapes_exceeded_body_size_limit_total
-
prometheus_target_scrapes_exceeded_sample_limit_total
-
prometheus_target_scrapes_sample_duplicate_timestamp_total
-
prometheus_target_scrapes_sample_out_of_bounds_total
-
prometheus_target_scrapes_sample_out_of_order_total
prometheus_target_sync_length_seconds_sum
-
prometheus_tsdb_blocks_loaded
-
prometheus_tsdb_compactions_failed_total
-
prometheus_tsdb_compactions_skipped_total
-
prometheus_tsdb_compactions_total
-
prometheus_tsdb_compactions_triggered_total
-
prometheus_tsdb_head_chunks
-
prometheus_tsdb_head_samples_appended_total
-
prometheus_tsdb_head_series
-
prometheus_tsdb_head_series_created_total
-
prometheus_tsdb_head_series_removed_total
-
prometheus_tsdb_reloads_failures_total
-
up