process exporter dashboard with treemap 12,18412,184 5.0 (1 reviews)
2/14/2021
4/19/2024
10
Host Metrics
Description
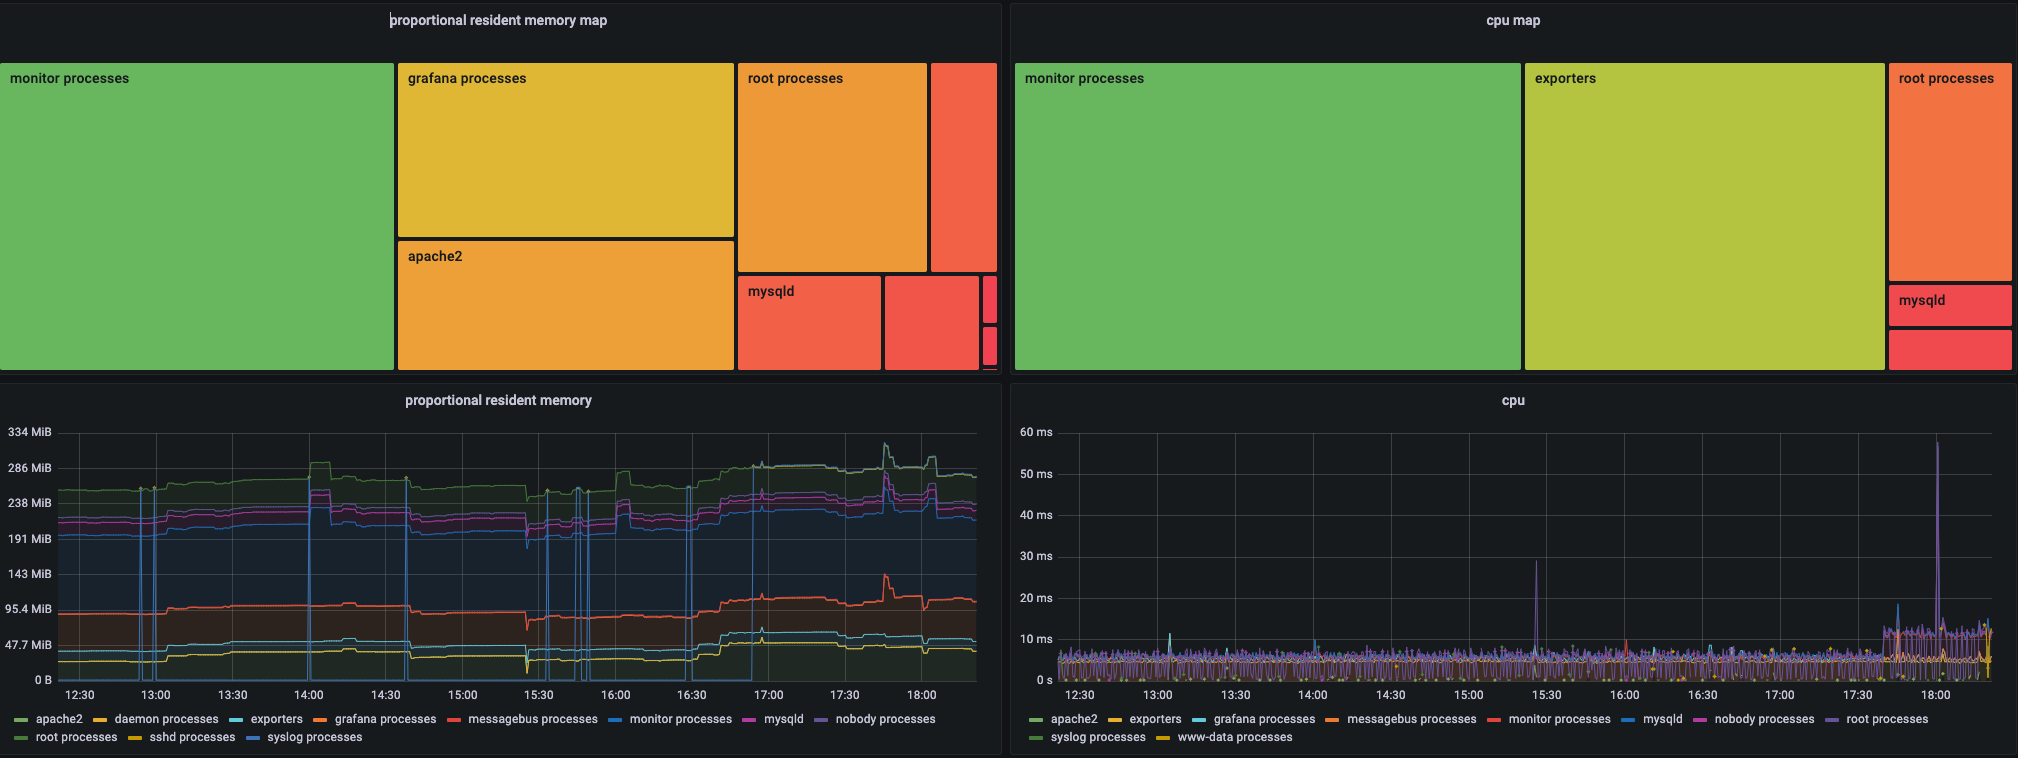
This dashboard is another version of Named processes dashboard Expects metrics exported by https://github.com/ncabatoff/process-exporter .
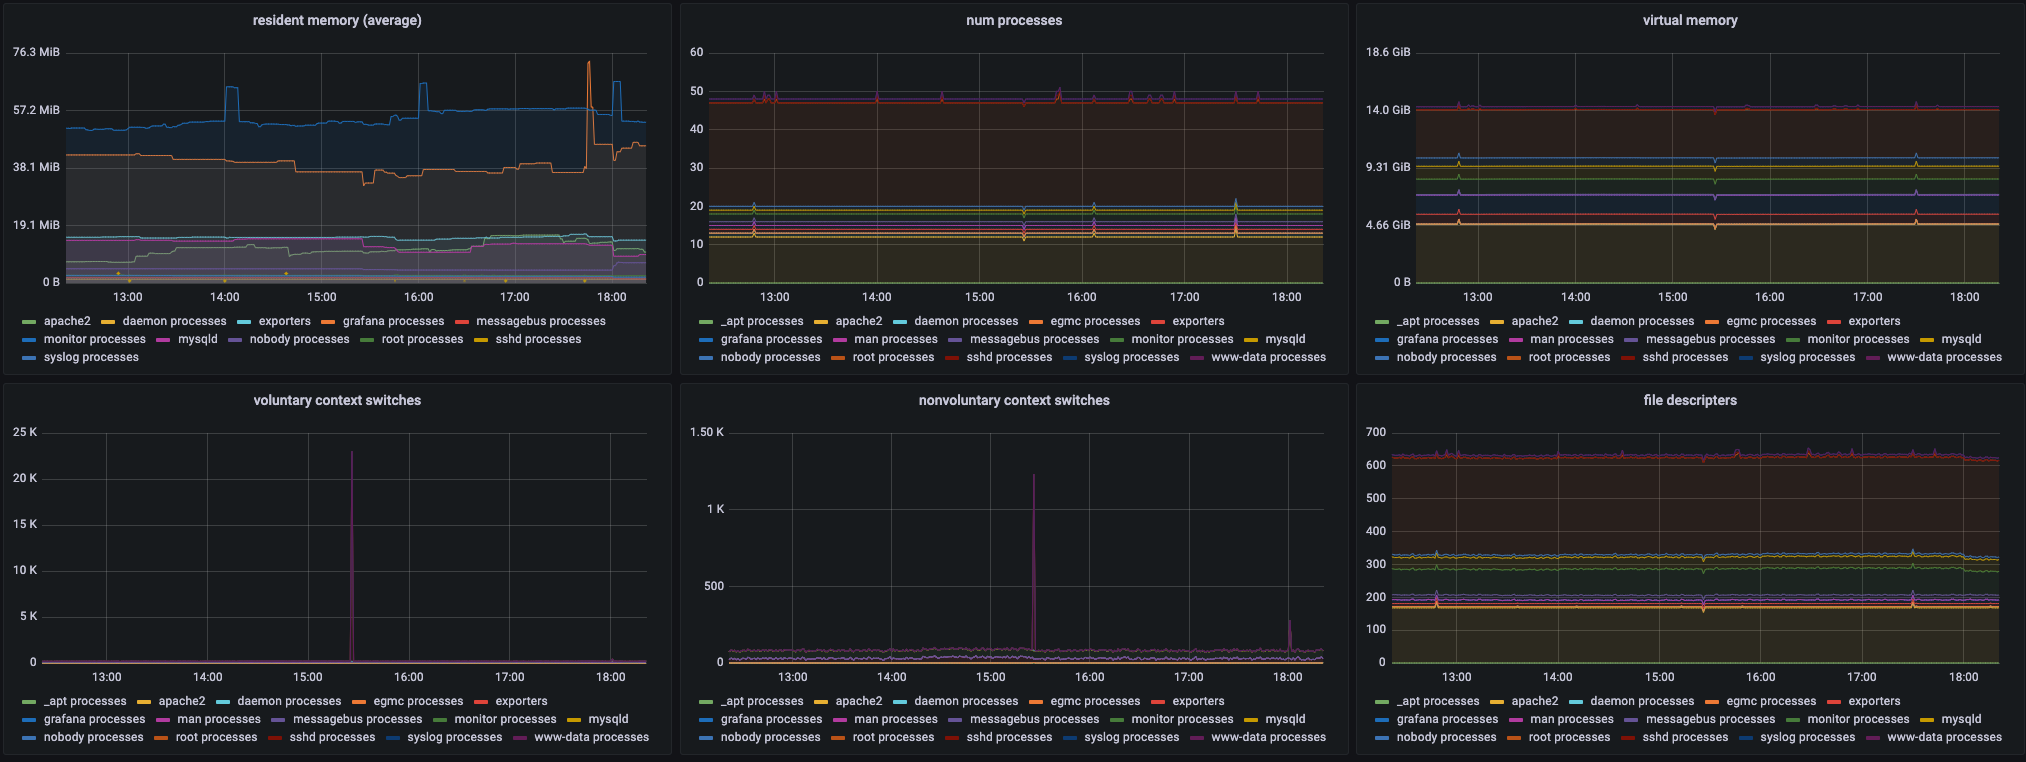
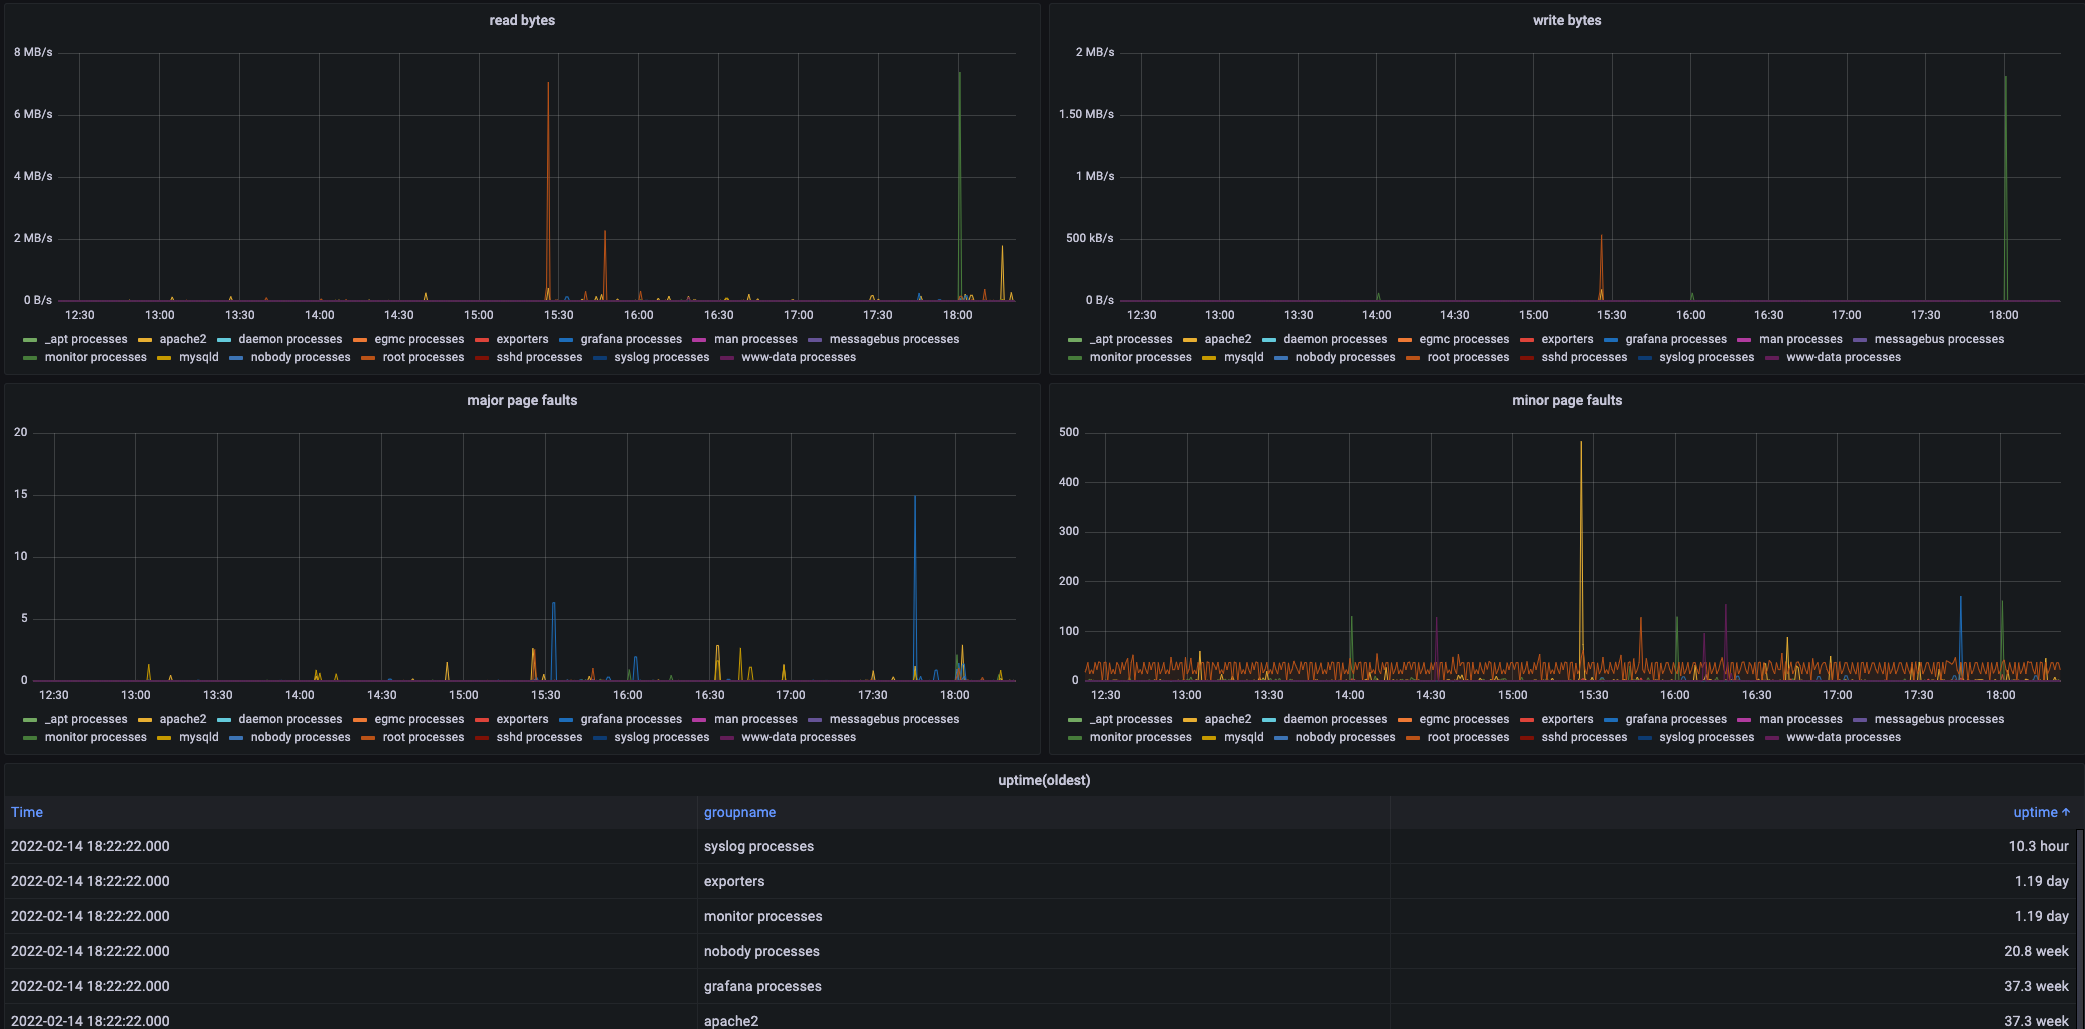
Screenshots
Used Metrics 1010
namedprocess_namegroup_context_switches_total
namedprocess_namegroup_cpu_seconds_total
namedprocess_namegroup_major_page_faults_total
namedprocess_namegroup_memory_bytes
namedprocess_namegroup_minor_page_faults_total
namedprocess_namegroup_num_procs
namedprocess_namegroup_oldest_start_time_seconds
namedprocess_namegroup_open_filedesc
namedprocess_namegroup_read_bytes_total
namedprocess_namegroup_write_bytes_total
Get Dashboard✕
Download
Copy to Clipboard