Predator <mars> 60,96860,968
1/27/2020
9/25/2020
2
>=7.0.3
Prometheus
Description
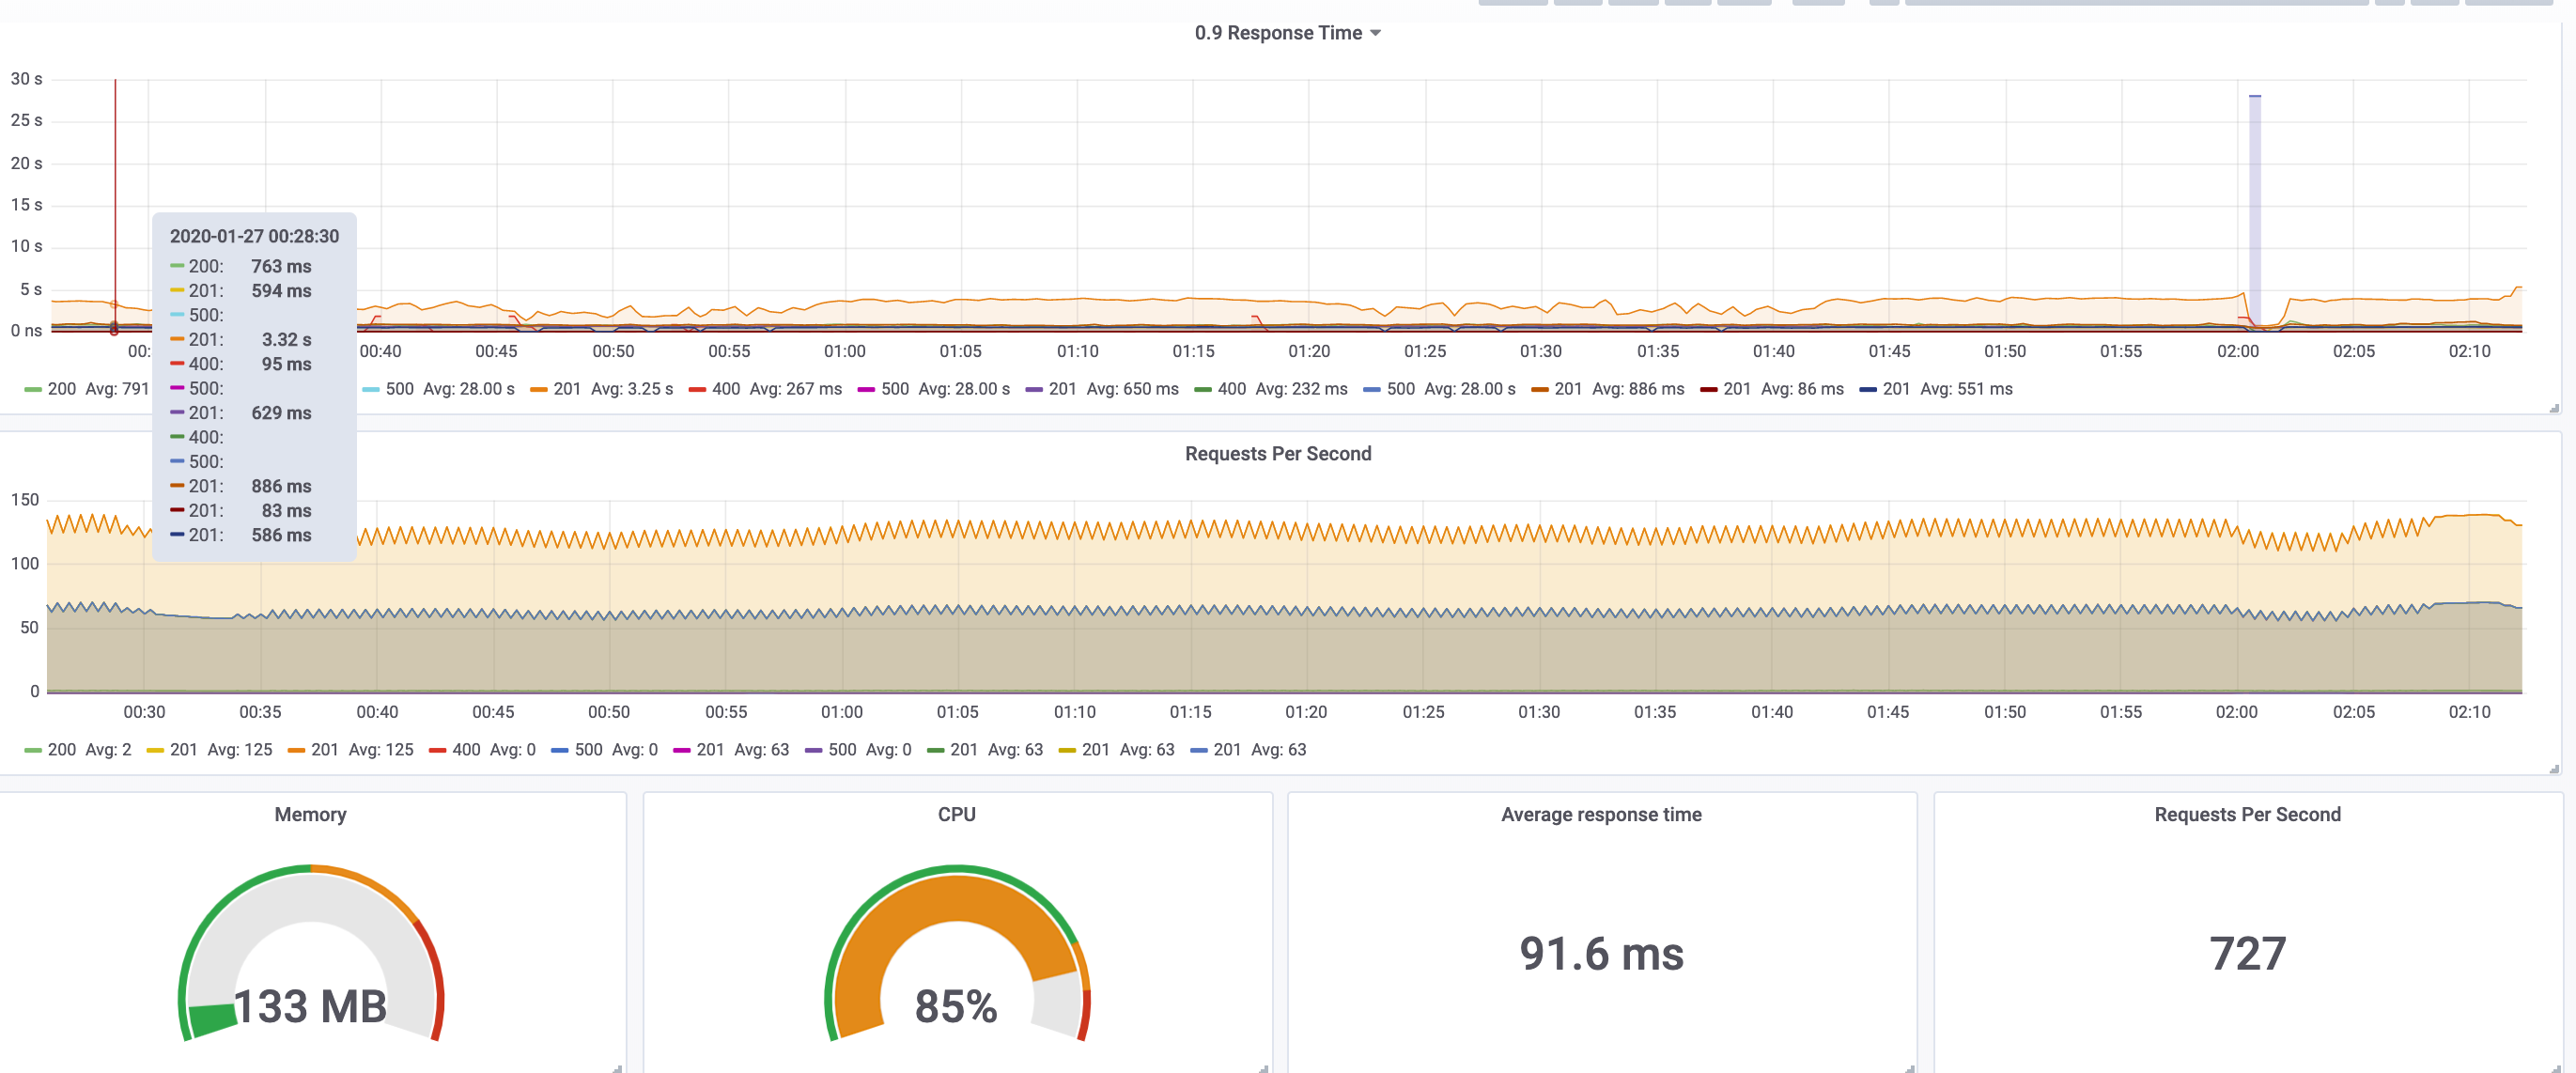
This dashboard monitors system performance and request latency for a Mars-era service, aggregating key latency and throughput metrics. It highlights percentile-based response times with Percentile and request_duration_seconds_bucket, tracks throughput via Requests Per Second and request_with_phases_duration_seconds_count, and surfaces resource health through CPU and Memory metrics such as runnerStats to indicate capacity and load.
Screenshots
Used Metrics 77
Percentile
request_duration_seconds_bucket
request_duration_seconds_count
request_with_phases_duration_seconds_bucket
request_with_phases_duration_seconds_count
runnerStats
topk
Get Dashboard✕
Download
Copy to Clipboard