PostgreSQL Statistics 65,98965,989
Description
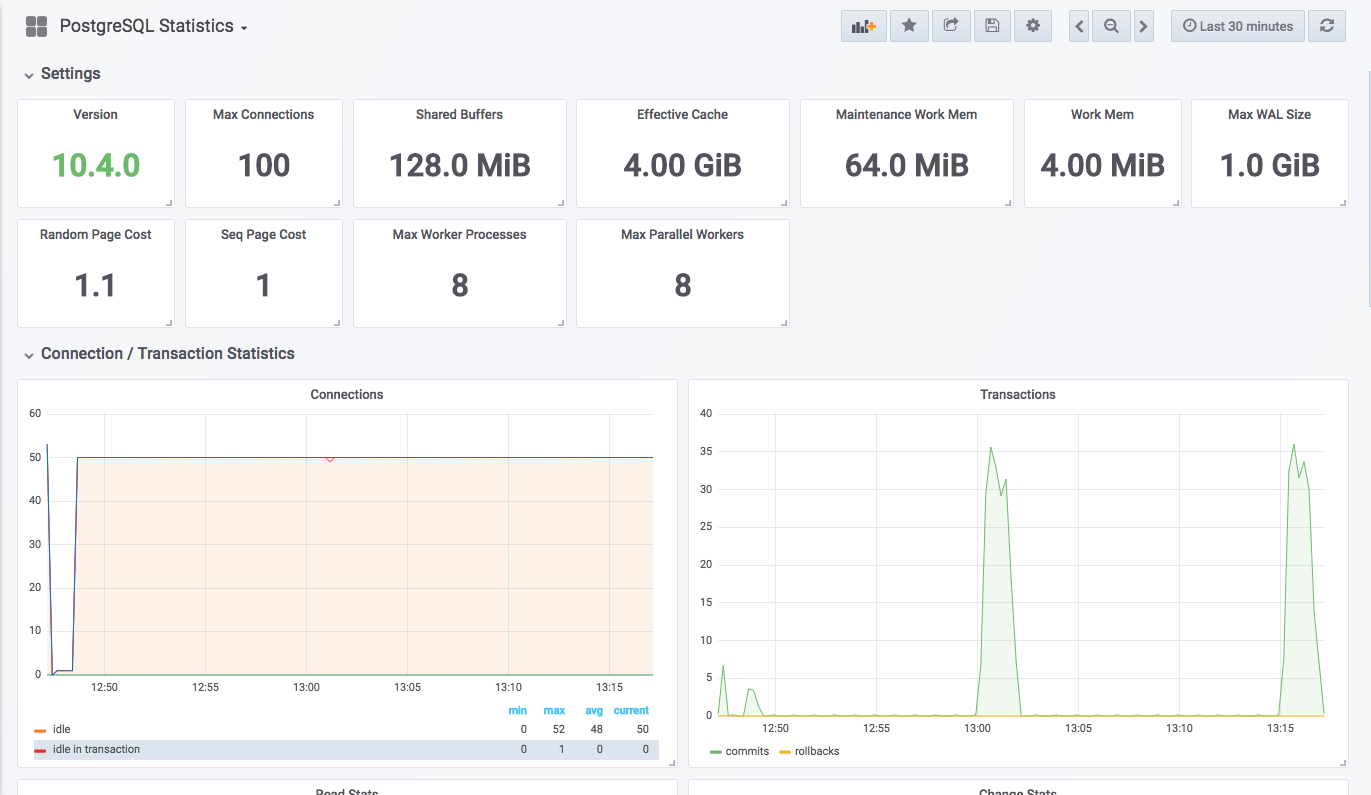
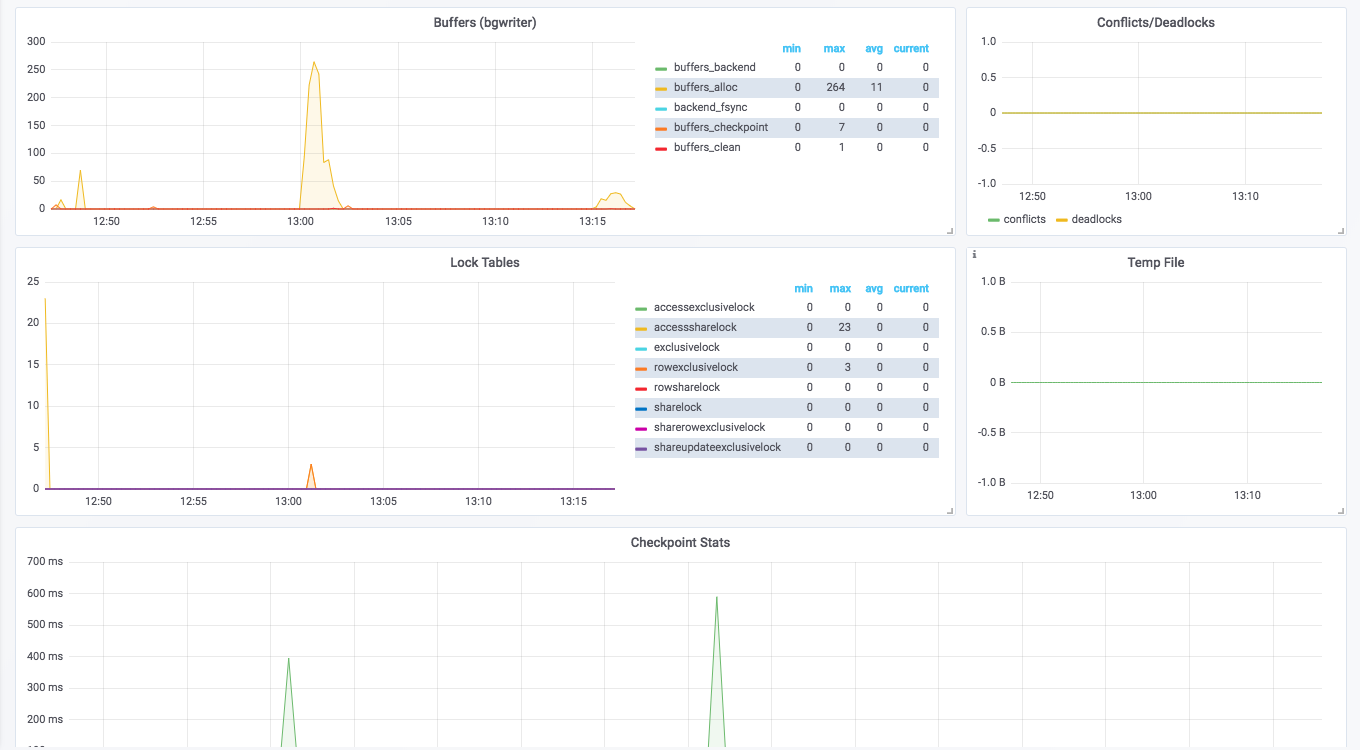
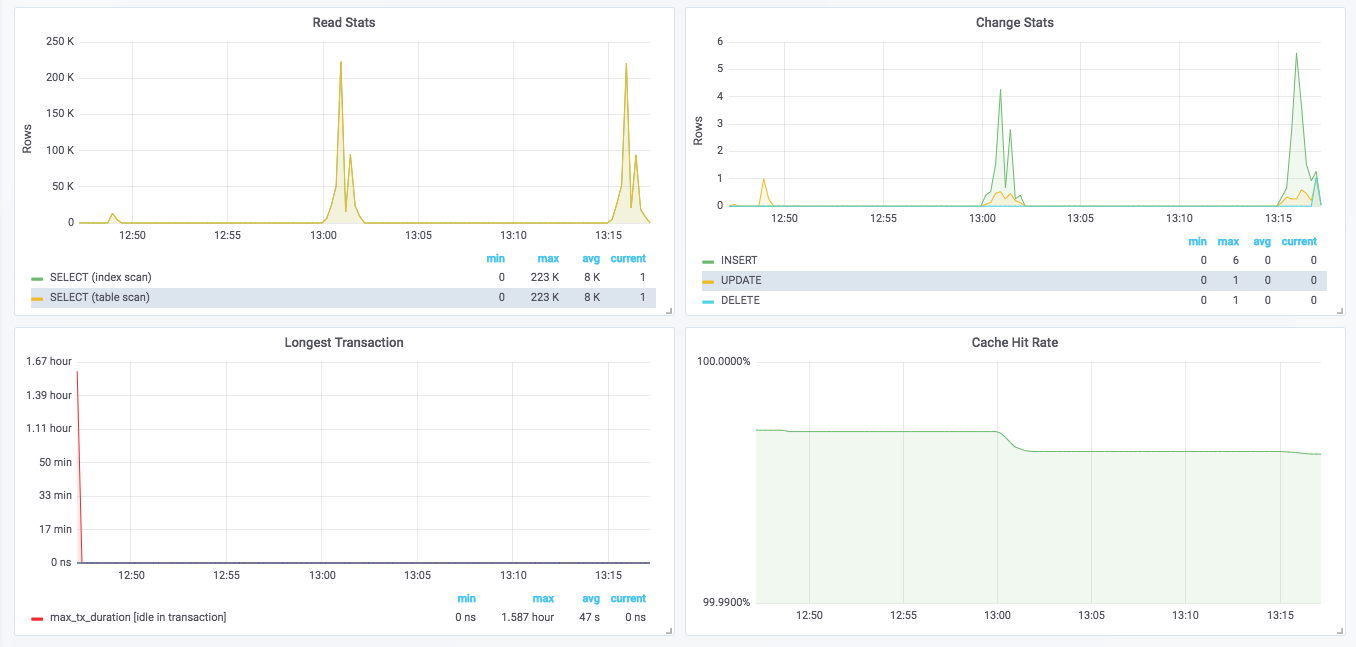
This dashboard monitors PostgreSQL server health and configuration impact through metrics derived from pg_static and pg_settings_* sources, offering a snapshot of runtime statistics and resource settings. Key features include time-series views of memory and cost parameters such as pg_settings_shared_buffers_bytes, pg_settings_effective_cache_size_bytes, and pg_settings_work_mem_bytes, plus a focus on connections and transaction activity with panels like Max Connections, Connections, and Transactions. It highlights performance sensitivity through metrics like pg_settings_random_page_cost, pg_settings_seq_page_cost, and pg_settings_max_wal_size_bytes, and surfaces operational bottlenecks with panels such as Lock Tables, Conflicts/Deadlocks, and Read Stats / Change Stats.
Screenshots
Used Metrics 3333
-
pg_locks_count
-
pg_settings_effective_cache_size_bytes
-
pg_settings_maintenance_work_mem_bytes
-
pg_settings_max_connections
-
pg_settings_max_parallel_workers
-
pg_settings_max_wal_size_bytes
-
pg_settings_max_worker_processes
-
pg_settings_random_page_cost
-
pg_settings_seq_page_cost
-
pg_settings_shared_buffers_bytes
-
pg_settings_work_mem_bytes
-
pg_stat_activity_count
-
pg_stat_activity_max_tx_duration
-
pg_stat_bgwriter_buffers_alloc
-
pg_stat_bgwriter_buffers_backend
-
pg_stat_bgwriter_buffers_backend_fsync
-
pg_stat_bgwriter_buffers_checkpoint
-
pg_stat_bgwriter_buffers_clean
-
pg_stat_bgwriter_checkpoint_sync_time
-
pg_stat_bgwriter_checkpoint_write_time
-
pg_stat_database_blks_hit
-
pg_stat_database_blks_read
-
pg_stat_database_conflicts
-
pg_stat_database_deadlocks
-
pg_stat_database_temp_bytes
-
pg_stat_database_tup_deleted
-
pg_stat_database_tup_fetched
-
pg_stat_database_tup_inserted
-
pg_stat_database_tup_returned
-
pg_stat_database_tup_updated
-
pg_stat_database_xact_commit
-
pg_stat_database_xact_rollback
-
pg_static