PostgreSQL Queries Overview (Designed for PMM) 17,56217,562 3.0 (1 reviews)
4/9/2019
4/24/2019
1
>=5.1.3
Prometheus
Description
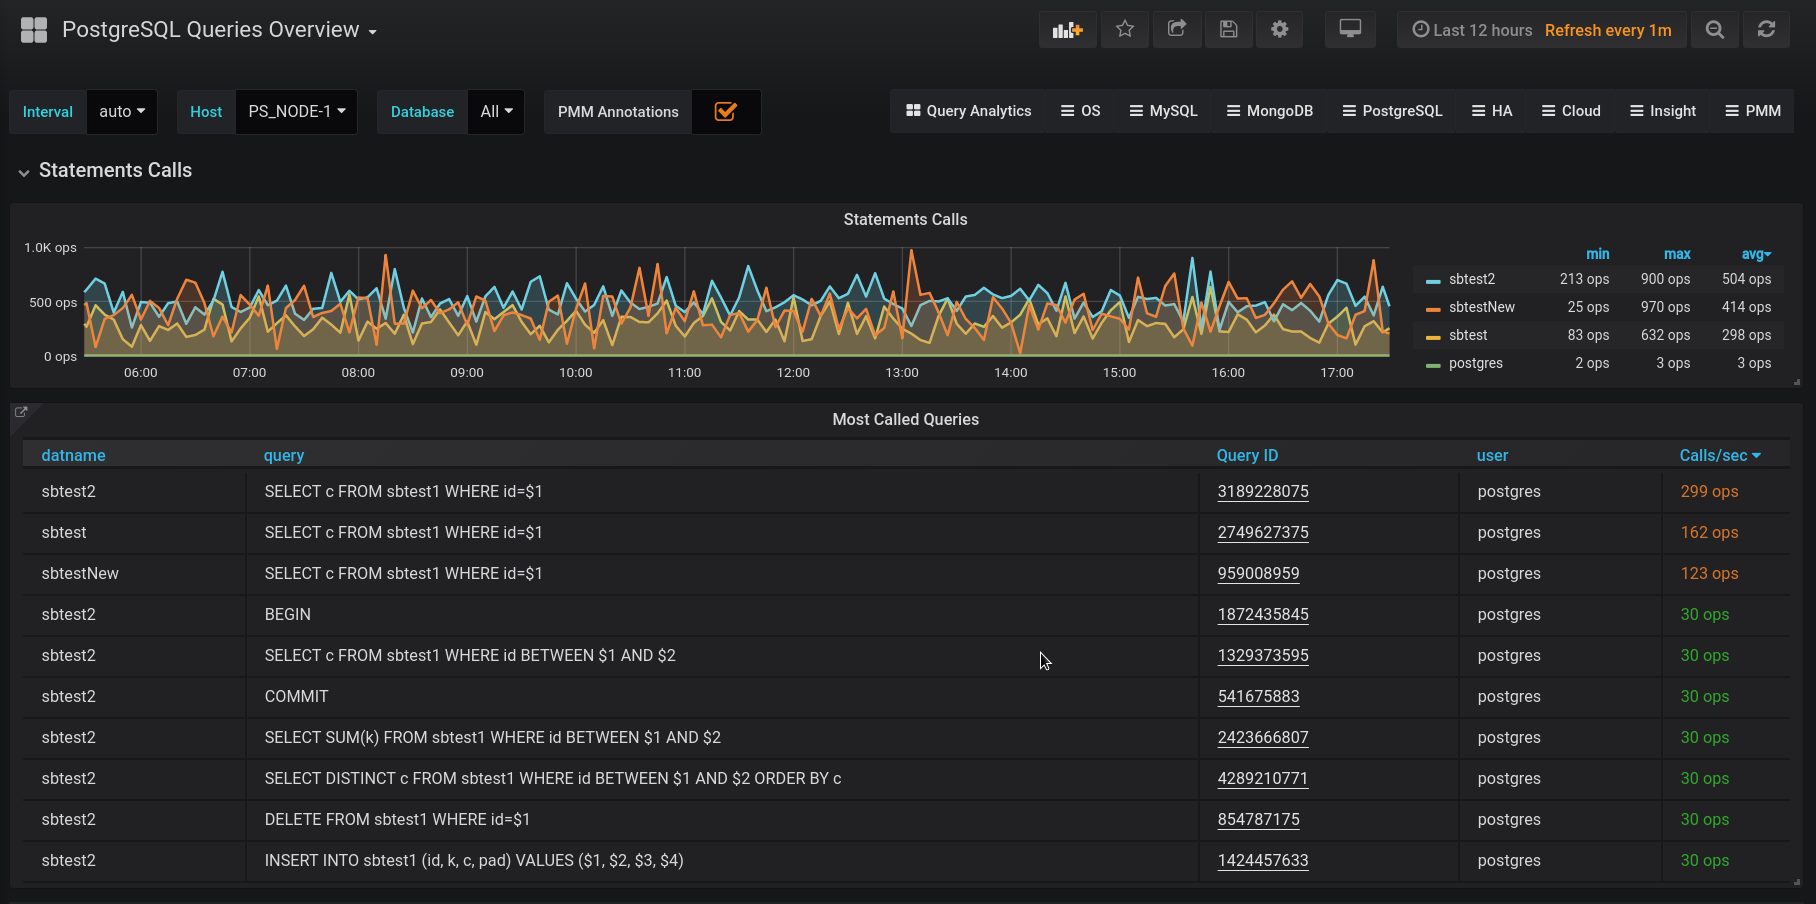
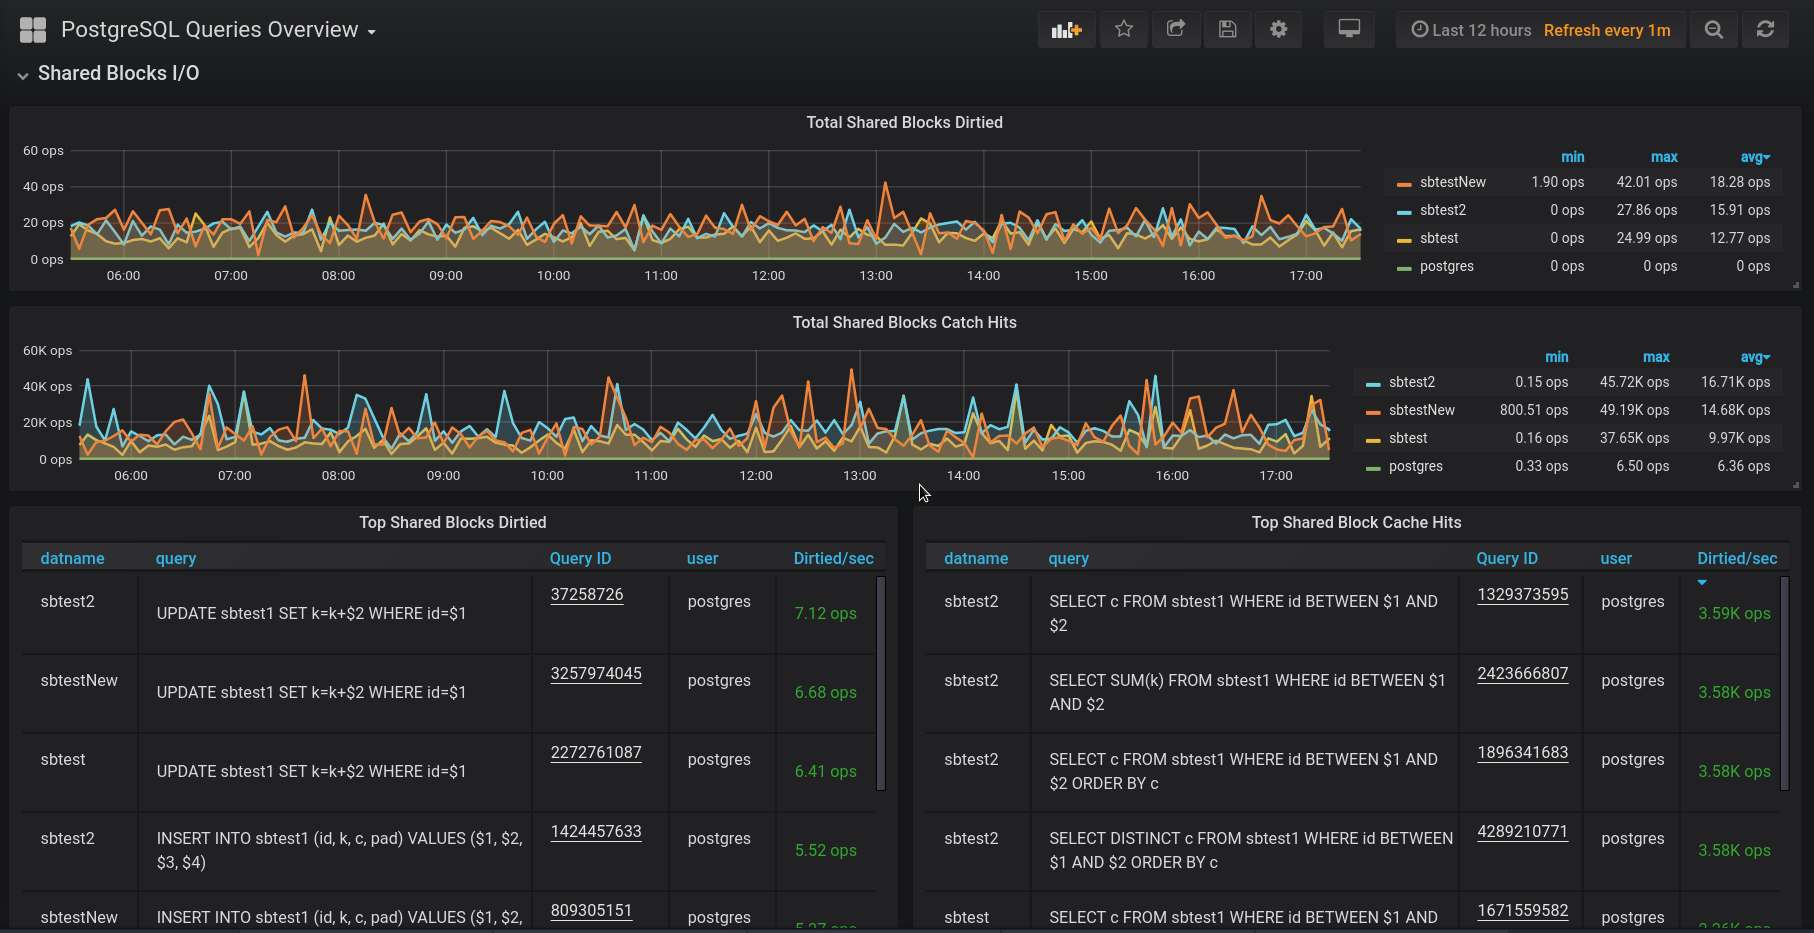
PostgreSQL Queries Overview Dashboard
Screenshots
Used Metrics 33
interval
pg_stat_statements_calls
topk
Get Dashboard✕
Download
Copy to Clipboard