PostgreSQL Overview (Postgres_exporter) 73,32073,320 2.0 (2 reviews)
5/12/2020
5/12/2020
4
Databases
>=6.7.3
Prometheus
Description
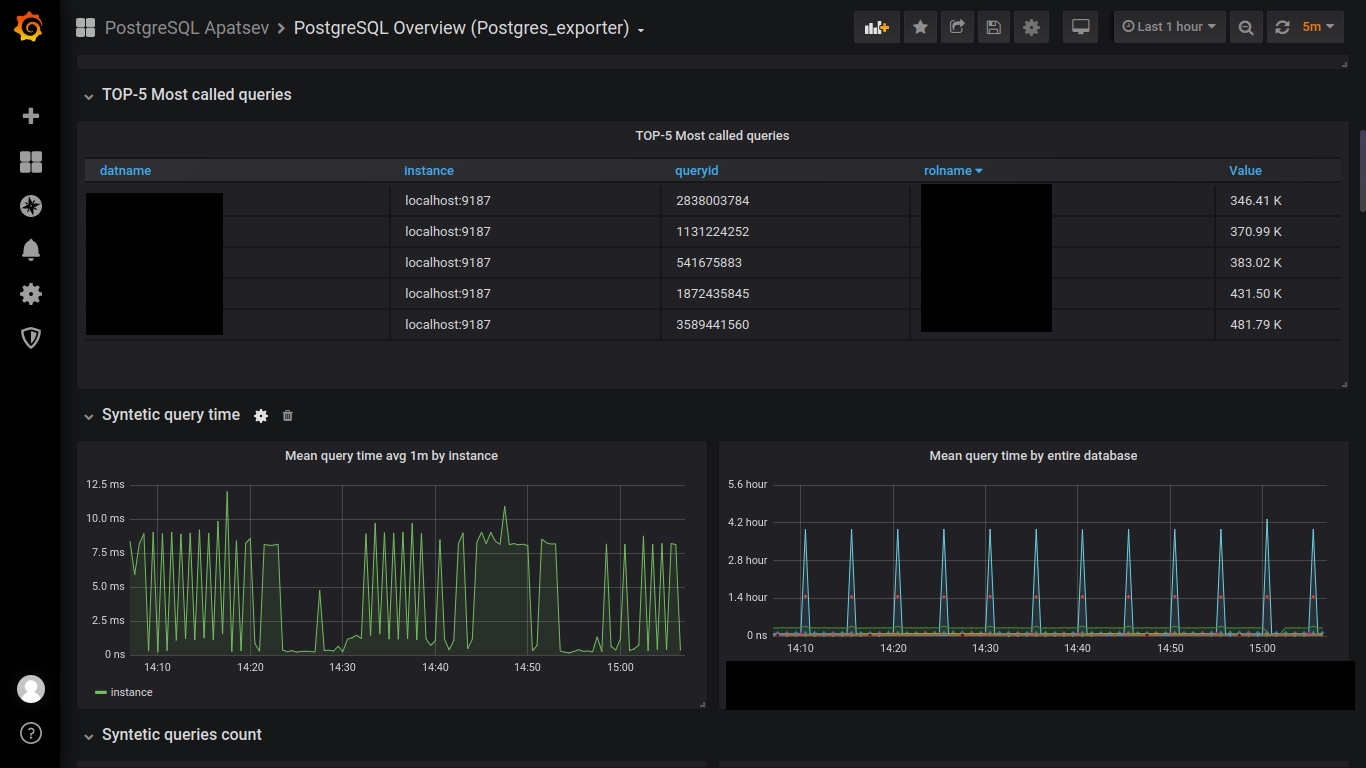
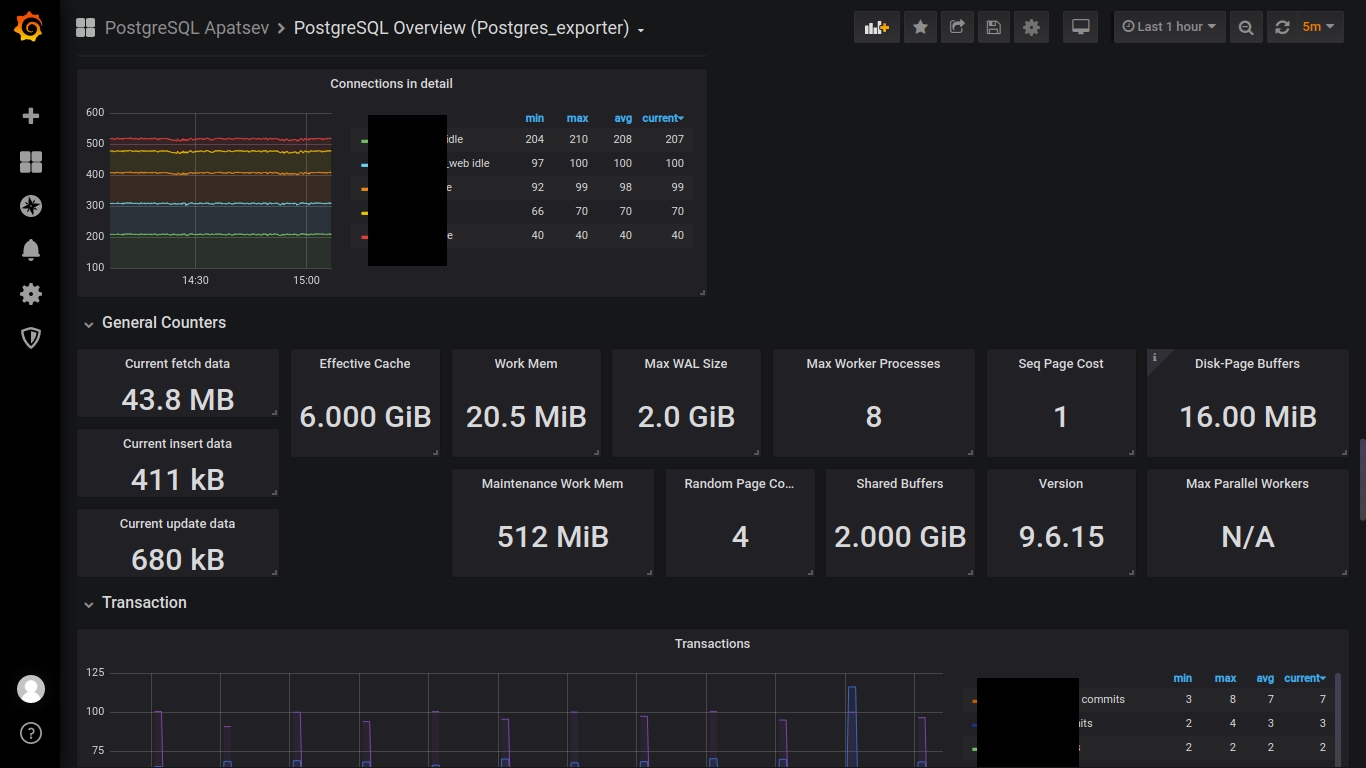
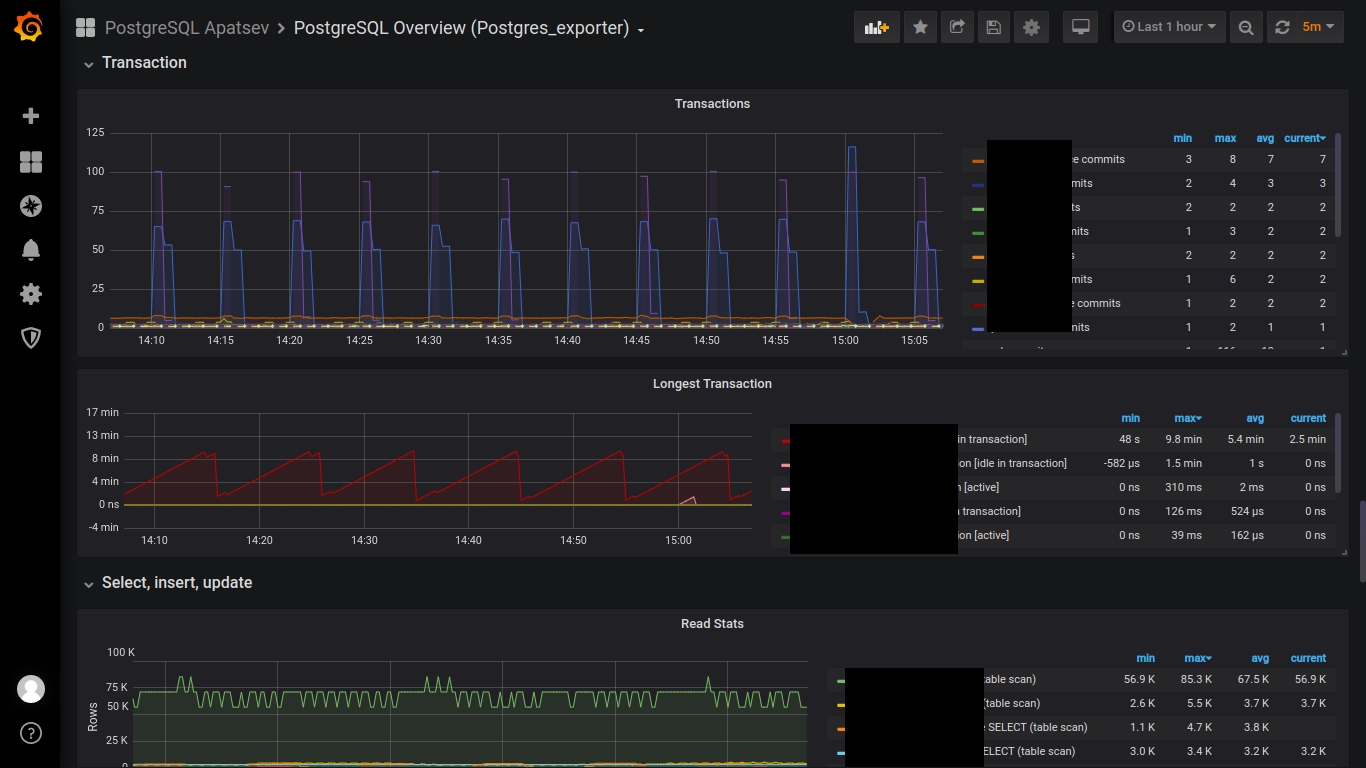
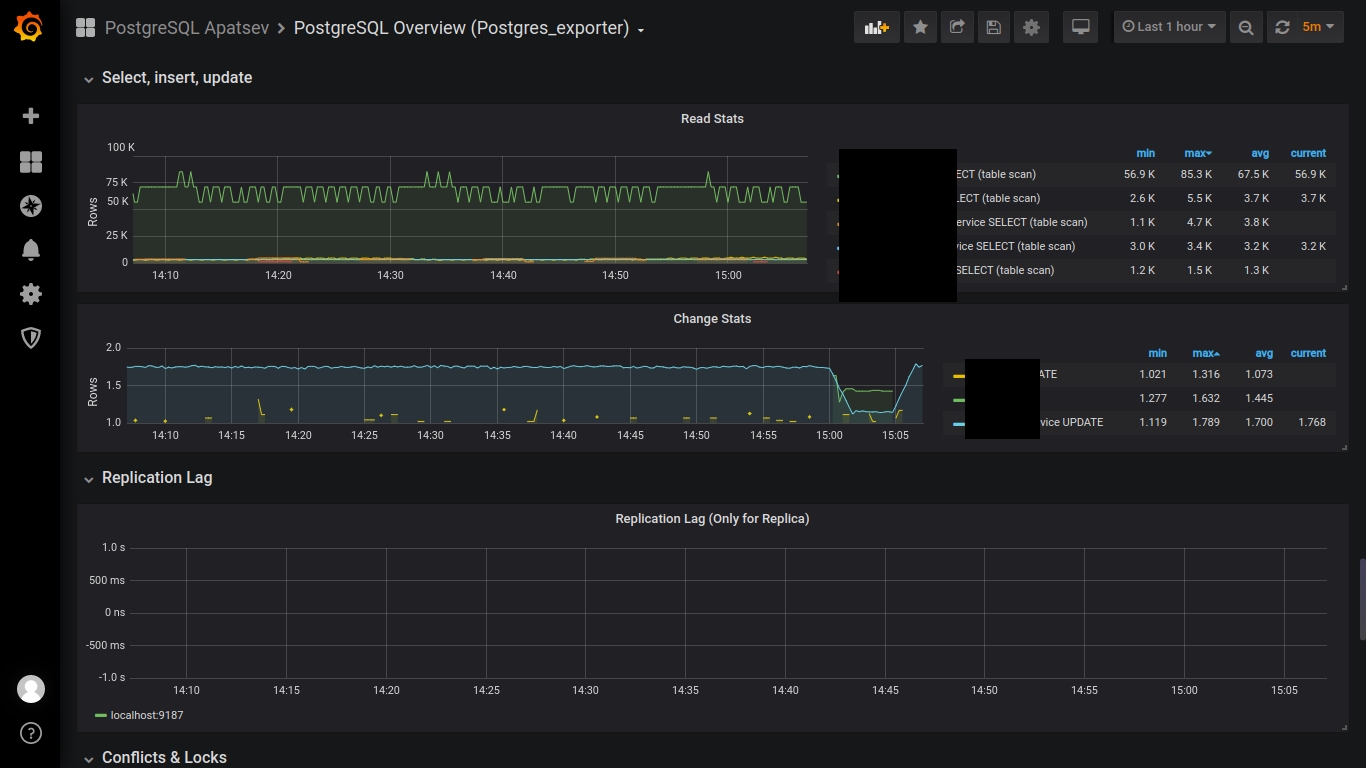
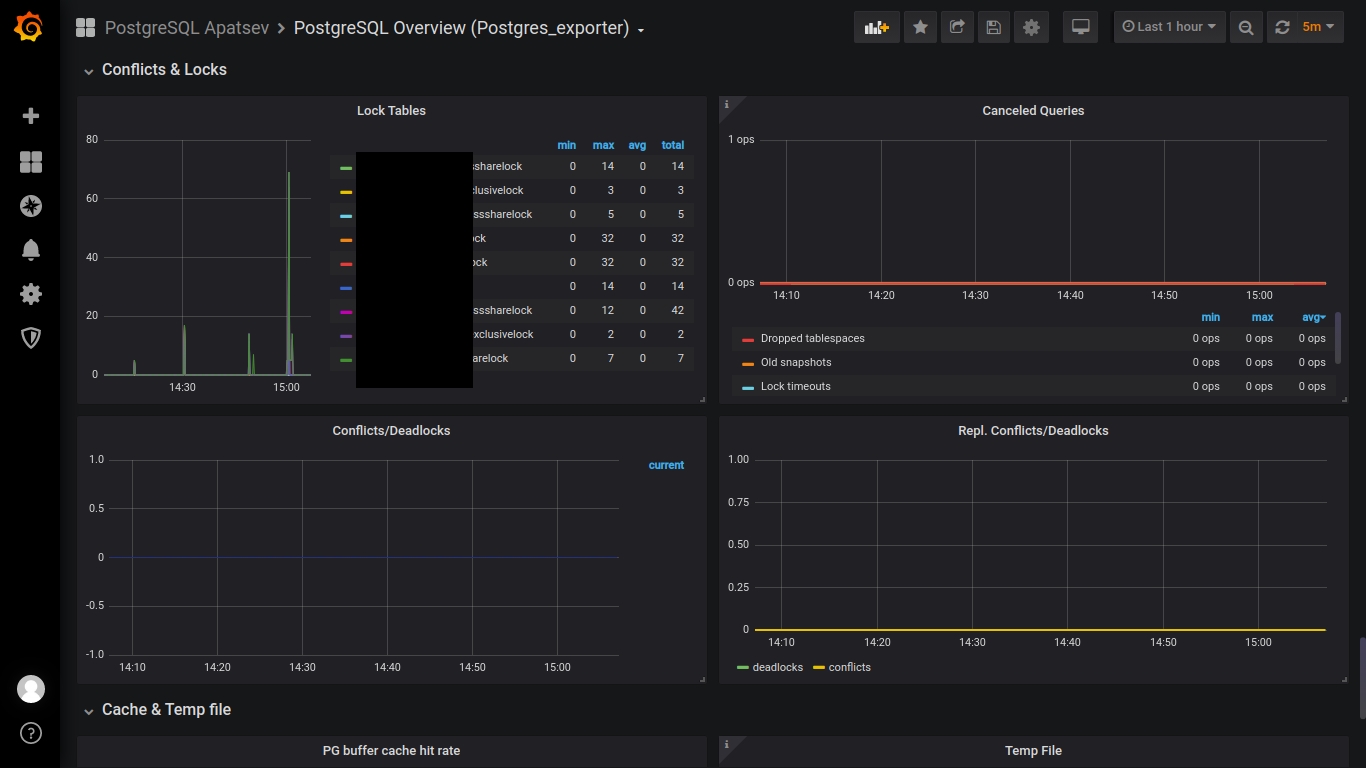
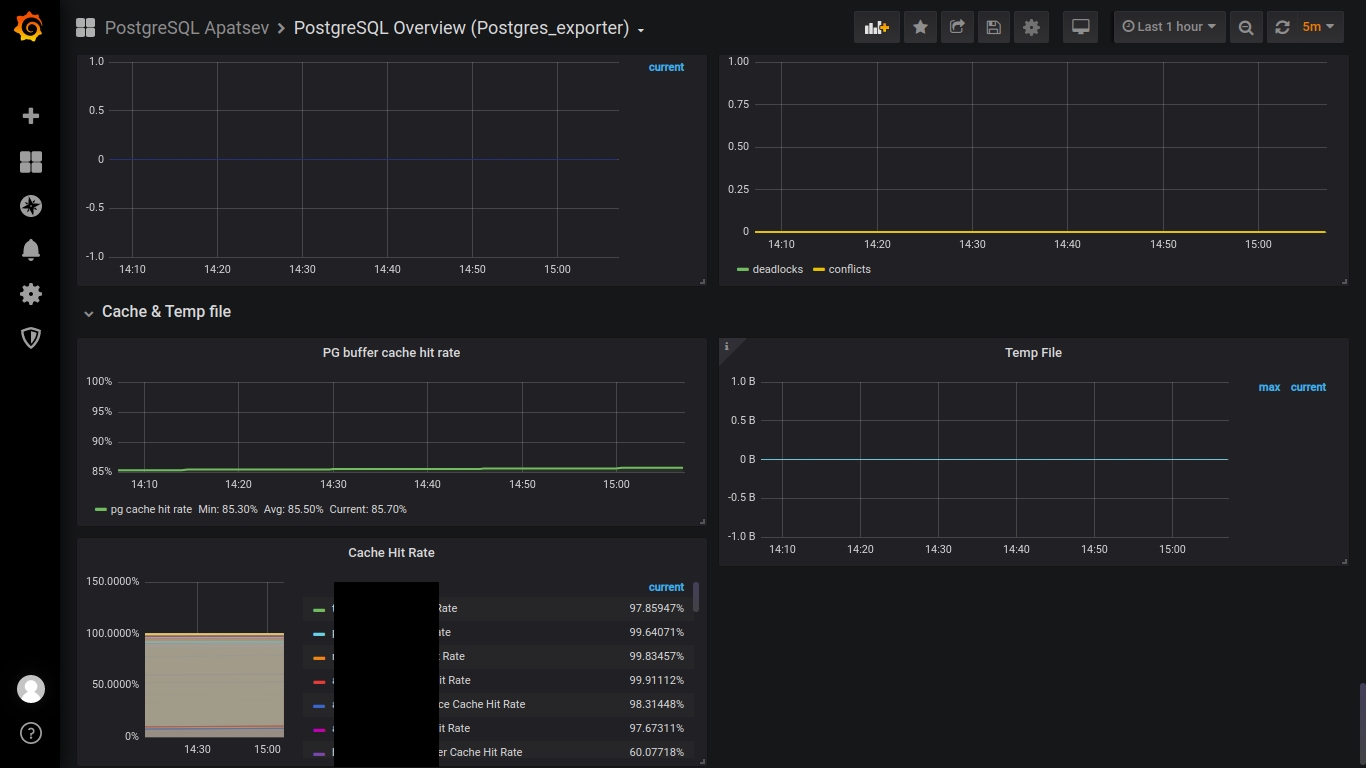
This dashboard provides a concise view of PostgreSQL health and performance by querying metrics exposed by the postgres_exporter. It highlights core indicators such as pg_up, pg_stat_activity, and pg_stat_database to surface connection activity, overall query load, and database-wide statistics. Key features include real-time status checks, per-database metrics, and alert-ready signals that help identify idle connections, long-running queries, and cache/buffer usage across the cluster.
Screenshots
Get Dashboard✕
Download
Copy to Clipboard