PostgreSQL DB/Table Size Details (Designed for PMM2)
1,274

Created 3/9/2020
Updated 8/6/2021
Revision 3
Categories
Databases
Grafana Version >=6.5.1
Datasources
Prometheus

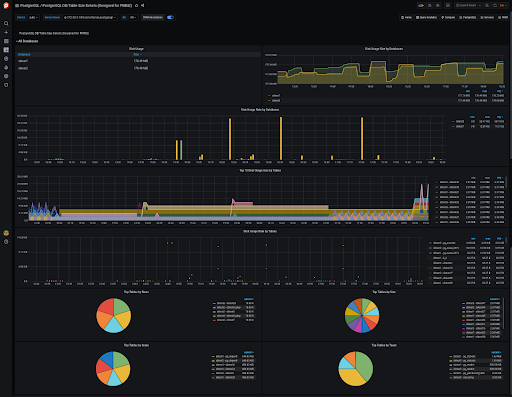
This dashboard gives an overview of database and table sizes and their rate of growth. The output from the pg_class catalog requires a custom query to be added to your environment.

Custom query can be found in https://raw.githubusercontent.com/Percona-Lab/pmm-custom-queries/master/postgresql/pg_table_size-details.yaml and should be placed in the /usr/local/percona/pmm2/collectors/custom-queries/postgresql/low-resolution directory.


If you’re using a PMM version older than 2.16.0, use the following instructions:

We propose to use our bash script (https://github.com/Percona-Lab/pmm-custom-queries/blob/master/postgresql/postgres_query_pg_class_generator.sh) that generates a query and forms other fields for a custom query file. You have to specify the database name, or names, that will be monitored. You can store the script result in a separate file or extend an existing file with queries. $ ./postgres_query_pg_class_generator.sh sbtest sbtest2 >> queries-postgres-2.yml Next metrics are collected: pg_class_table_rows pg_class_disk_usage_table_bytes pg_class_disk_usage_index_bytes pg_class_disk_usage_toast_bytes

Get Dashboard
Download
Copy to Clipboard
Source Grafana.com

Used Metrics 6

  • pg_class_disk_usage_table_bytes

  • interval

  • topk

  • pg_class_disk_usage_index_bytes

  • pg_class_disk_usage_toast_bytes

  • pg_class_table_rows