Postgresql 46,75146,751
Description
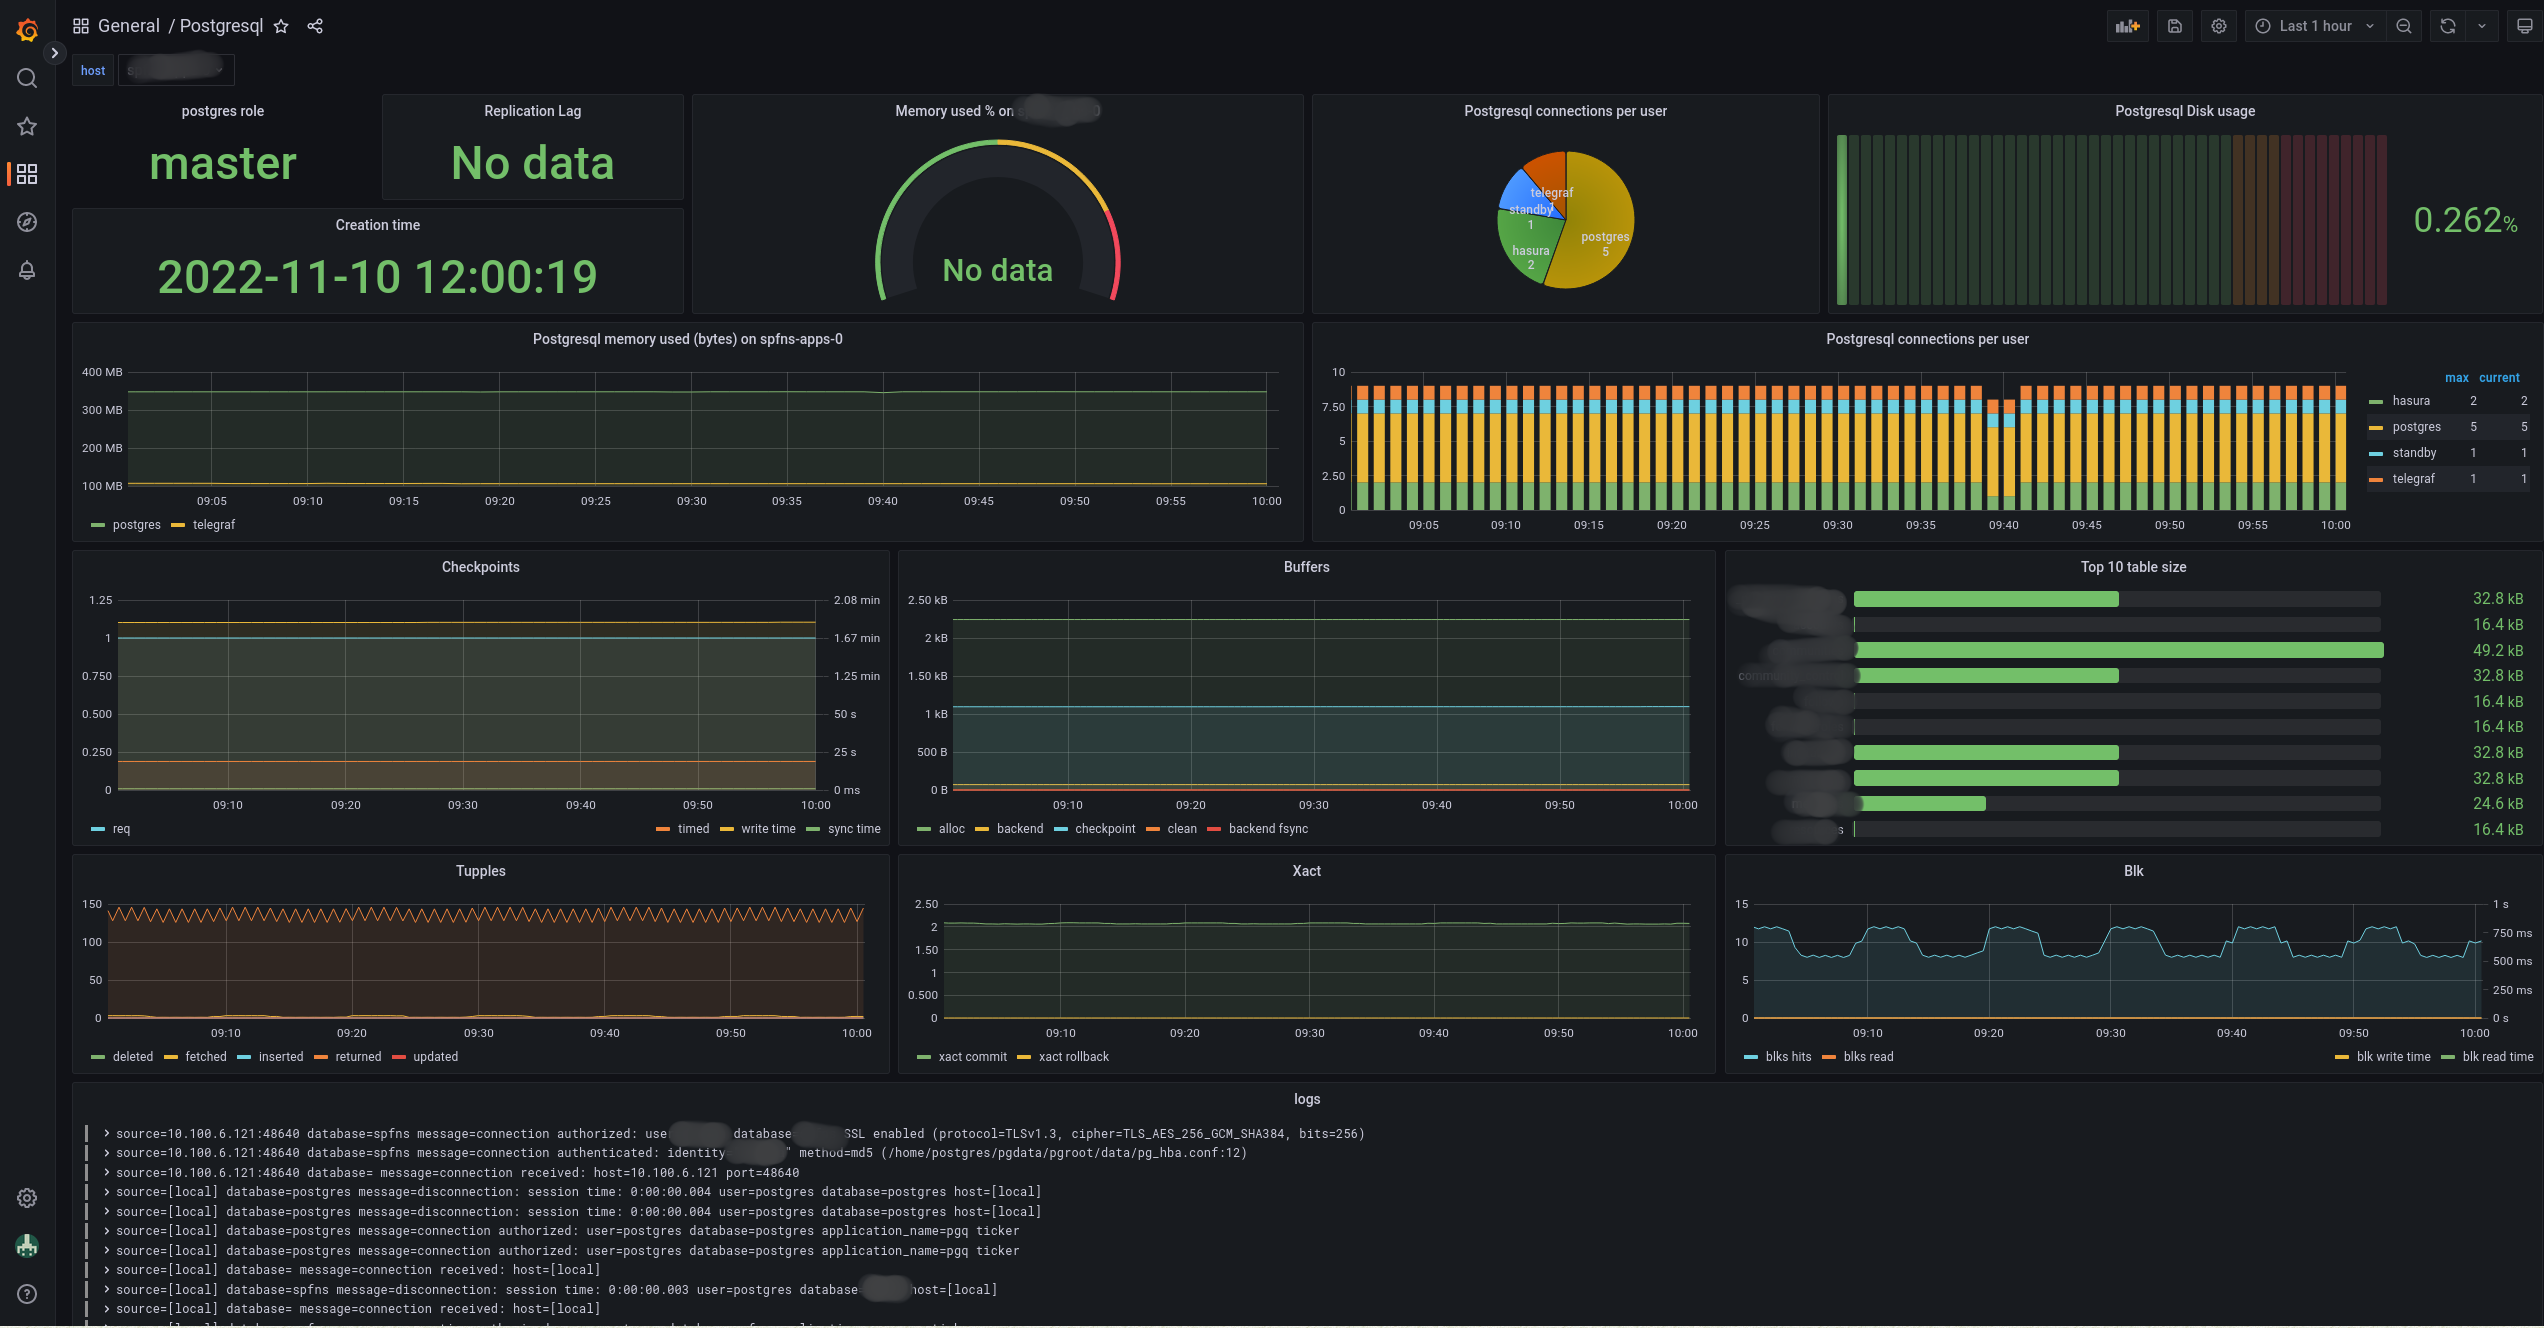
This dashboard monitors PostgreSQL health and performance with a focus on replication, memory, and disk usage. It highlights critical metrics such as postgresql_replication_lag, postgresql_nb_connections, and disk_used_percent, while also surfacing system-level container metrics like container_memory_usage_bytes and container_start_time_seconds to correlate database activity with host resources. Key panels include replication lag trends, per-user connections, and top table size, complemented by checkpoint and buffer activity for deep dive diagnostics.
Screenshots

Used Metrics 3333
-
container_memory_usage_bytes
-
container_start_time_seconds
database
disk_used_percent
json
kube_pod_container_resource_limits
line_format
message
postgresql_blk_read_time
postgresql_blk_write_time
postgresql_blks_hit
postgresql_blks_read
postgresql_buffers_alloc
postgresql_buffers_backend
postgresql_buffers_backend_fsync
postgresql_buffers_checkpoint
postgresql_buffers_clean
postgresql_checkpoint_sync_time
postgresql_checkpoint_write_time
postgresql_checkpoints_req
postgresql_checkpoints_timed
postgresql_nb_connections
postgresql_numbackends
postgresql_replication_lag
postgresql_table_total_disc_size
postgresql_tup_deleted
postgresql_tup_fetched
postgresql_tup_inserted
postgresql_tup_returned
postgresql_tup_updated
postgresql_xact_commit
postgresql_xact_rollback
source