Postgres Overview 190,359190,359 5.0 (1 reviews)
Description
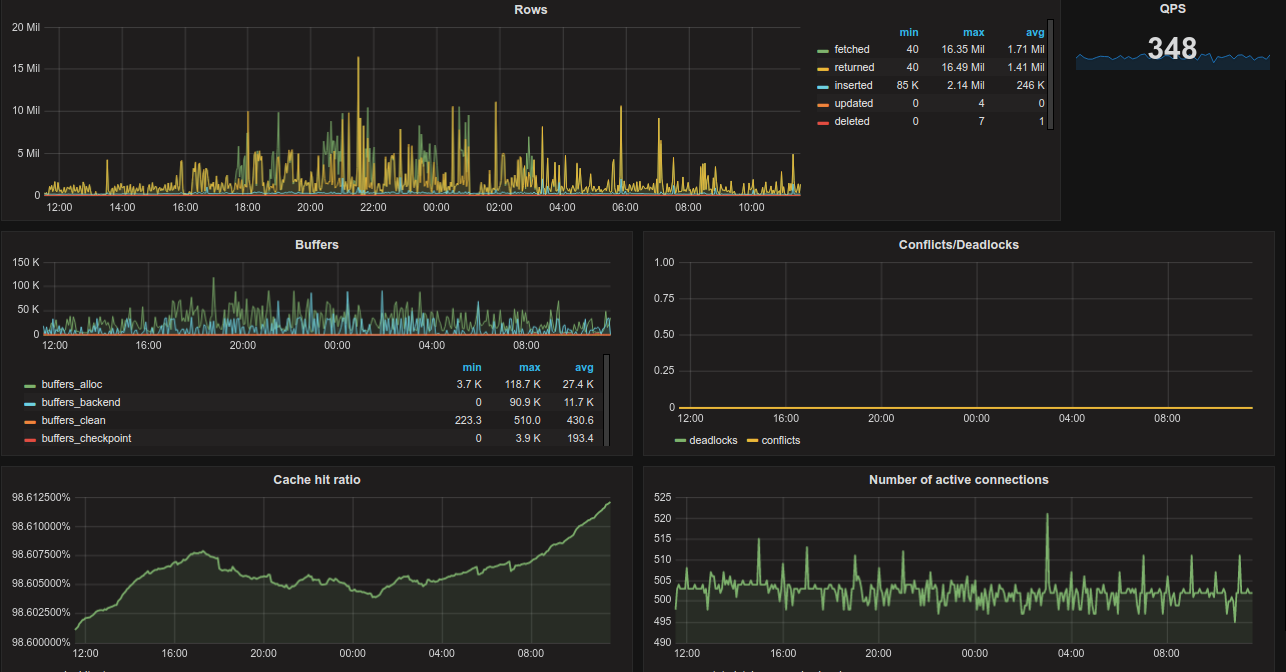
Monitors PostgreSQL system activity and health with a focus on query throughput, storage I/O, and connection workload. Key metrics include pg_stat_database_tup_fetched/_returned/_inserted/_updated/_deleted to gauge table activity, pg_stat_database_xact_commit and pg_stat_database_xact_rollback for transaction volatility, and background write signaling via pg_stat_bgwriter_buffers_alloc, _fsync, and _buffers_backend* to assess I/O efficiency and buffering behavior. The dashboard highlights panels for Rows, QPS, Buffers, Conflicts/Deadlocks, Cache hit ratio, and active connections to provide a concise view of throughput, contention, cache effectiveness, and connection pressure.
Screenshots
Used Metrics 1717
-
pg_stat_bgwriter_buffers_alloc
-
pg_stat_bgwriter_buffers_backend
-
pg_stat_bgwriter_buffers_backend_fsync
-
pg_stat_bgwriter_buffers_checkpoint
-
pg_stat_bgwriter_buffers_clean
-
pg_stat_database_blks_hit
-
pg_stat_database_blks_read
-
pg_stat_database_conflicts
-
pg_stat_database_deadlocks
-
pg_stat_database_numbackends
-
pg_stat_database_tup_deleted
-
pg_stat_database_tup_fetched
-
pg_stat_database_tup_inserted
-
pg_stat_database_tup_returned
-
pg_stat_database_tup_updated
-
pg_stat_database_xact_commit
-
pg_stat_database_xact_rollback