Postfix 123,772123,772 4.0 (5 reviews)
Description
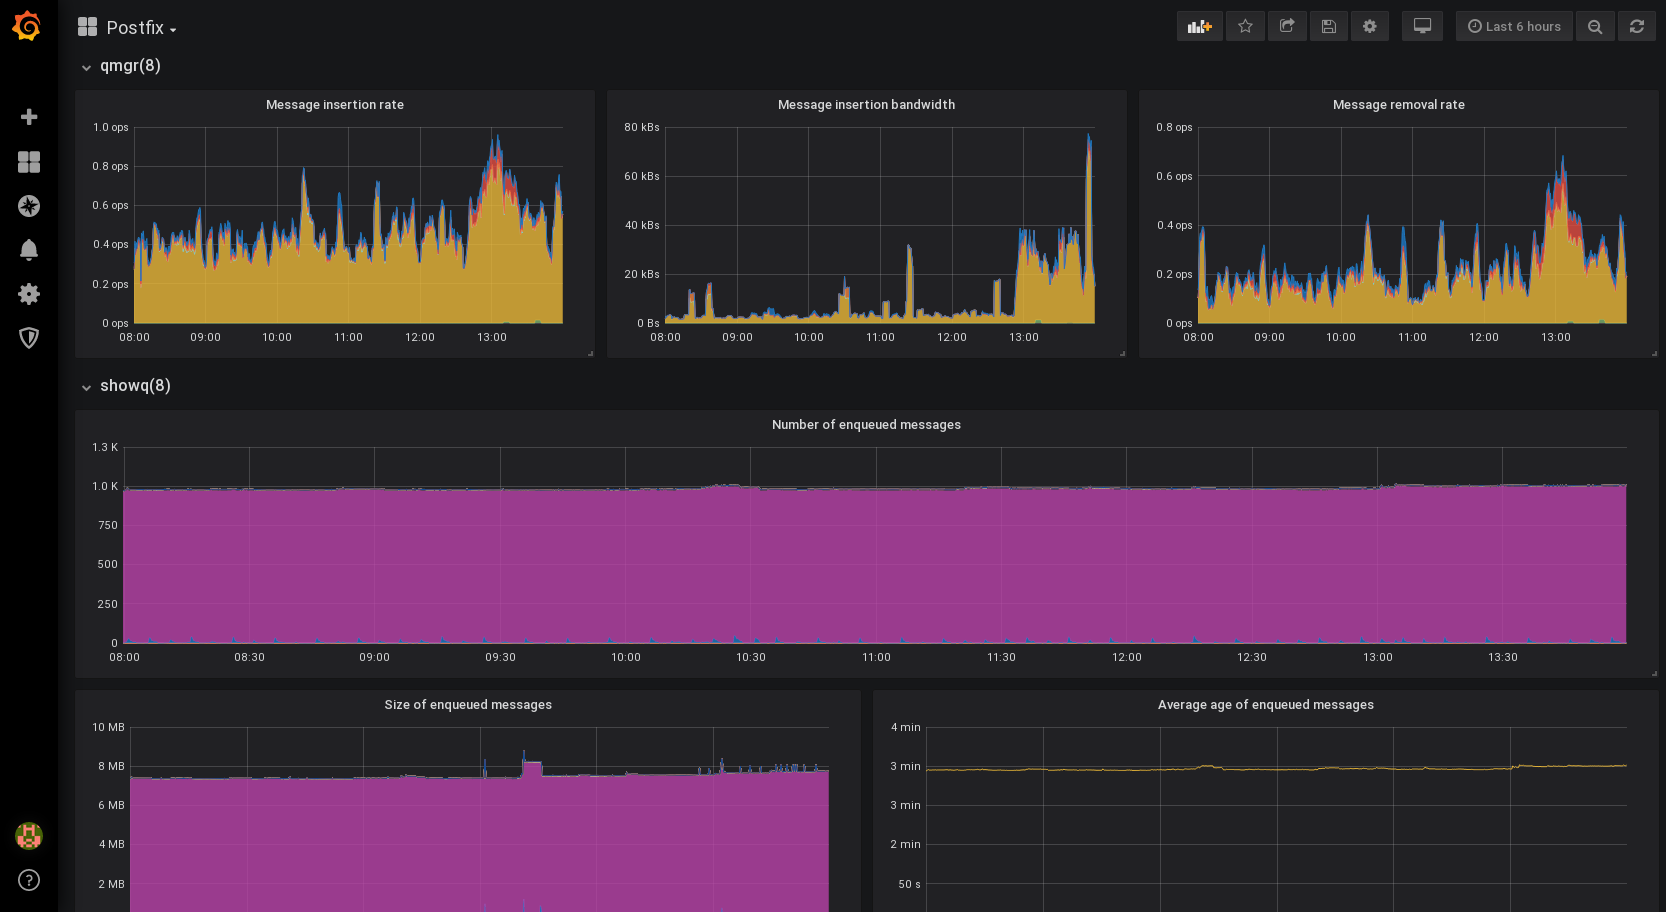
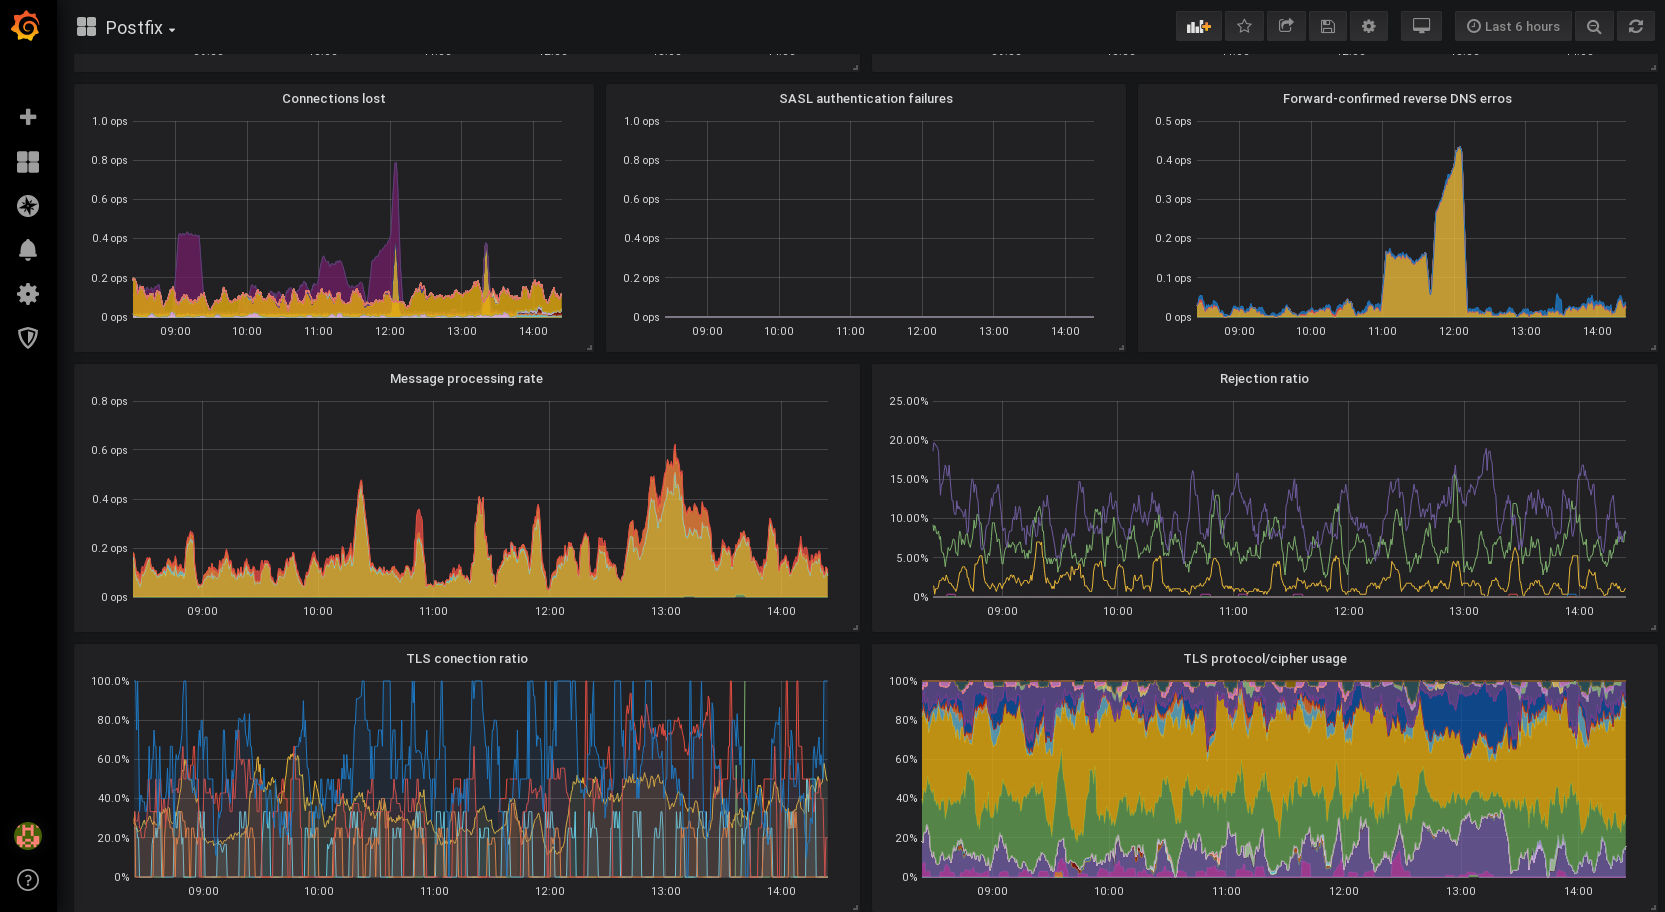
This dashboard monitors a Postfix mail system, focusing on message flow, delivery latency, and connection integrity. It surfaces operational health indicators such as postfix_cleanup_messages_processed_total and postfix_qmgr_messages_inserted_size_bytes_sum to track processing throughput and message size, while also highlighting latency via postfix_lmtp_delivery_delay_seconds_sum/_count and error/efficiency signals like postfix_cleanup_messages_rejected_total and TLS/SASL/authentication events for security posture.
Screenshots
Used Metrics 2323
postfix_cleanup_messages_processed_total
postfix_cleanup_messages_rejected_total
postfix_lmtp_delivery_delay_seconds_count
postfix_lmtp_delivery_delay_seconds_sum
postfix_lmtp_messages_processed_total
postfix_pipe_delivery_delay_seconds_count
postfix_qmgr_messages_inserted_size_bytes_count
postfix_qmgr_messages_inserted_size_bytes_sum
postfix_qmgr_messages_removed_total
postfix_showq_message_age_seconds_count
postfix_showq_message_size_bytes_count
postfix_showq_message_size_bytes_sum
postfix_smtp_delivery_delay_seconds_count
postfix_smtp_delivery_delay_seconds_sum
postfix_smtp_tls_connections_total
postfix_smtpd_connections_lost_total
postfix_smtpd_connects_total
postfix_smtpd_disconnects_total
postfix_smtpd_forward_confirmed_reverse_dns_errors_total
postfix_smtpd_messages_processed_total
postfix_smtpd_messages_rejected_total
postfix_smtpd_sasl_authentication_failures_total
postfix_smtpd_tls_connections_total