Podman Exporter Dashboard 3,9193,919
7/21/2024
7/21/2024
1
Docker
>=11.1.0
Prometheus
Description
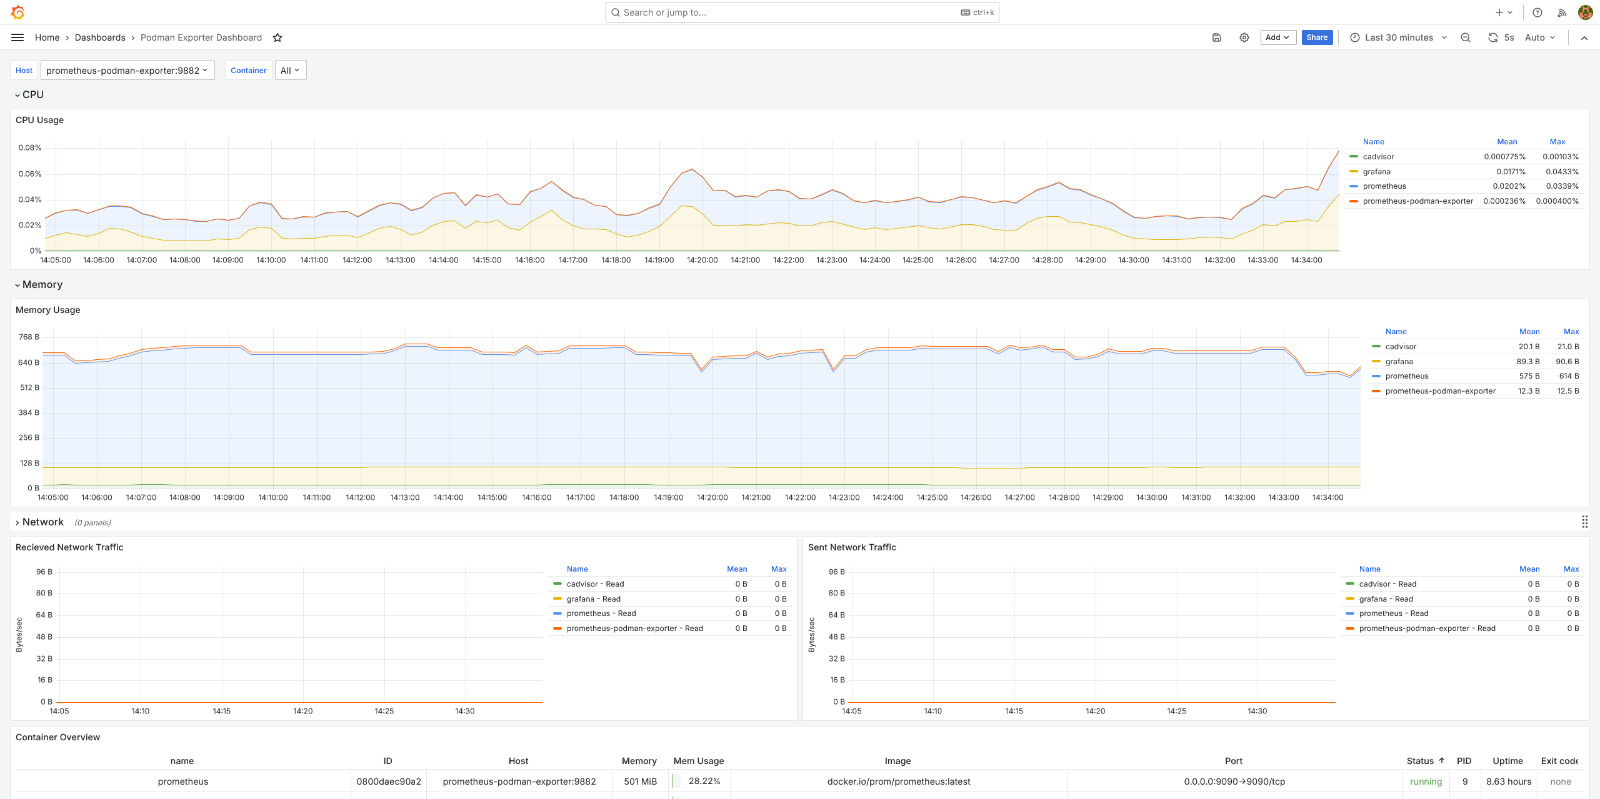
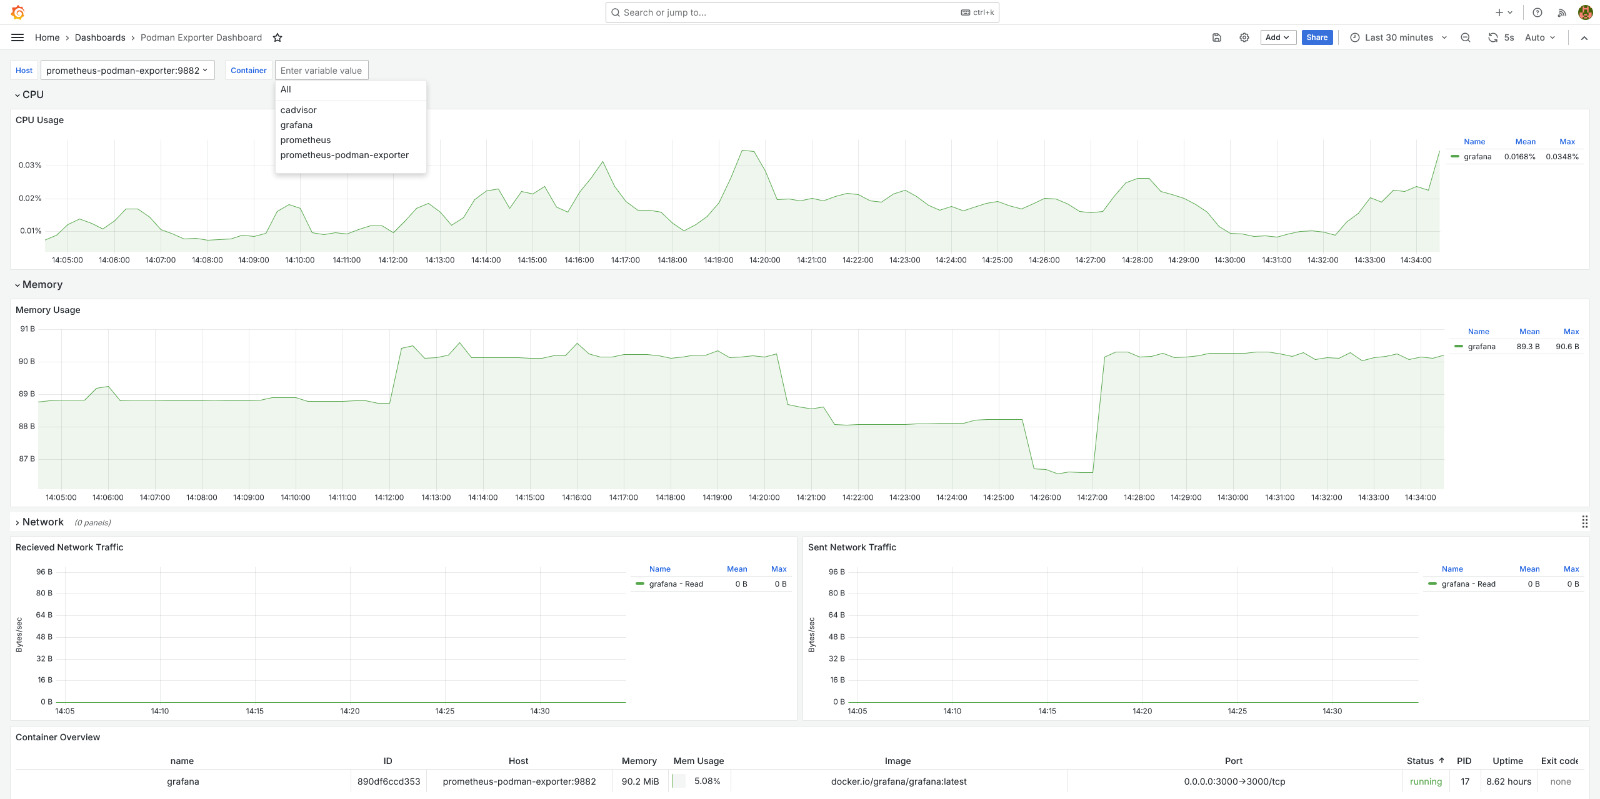
This dashboard leverages Prometheus podman exporter as the data source and utilizes various visualization panels like time series and tables, providing critical insights into the operational metrics of Podman containers.
Screenshots
Used Metrics 1212
name
podman_container_blkio_device_write_bytes_total
podman_container_cpu_seconds_total
podman_container_exit_code
podman_container_info
podman_container_mem_limit_bytes
podman_container_mem_usage_bytes
podman_container_net_input_total
podman_container_net_output_total
podman_container_pids
podman_container_started_seconds
podman_container_state
Get Dashboard✕
Download
Copy to Clipboard