Pod Statistic (Karpenter) 428,711428,711
5/6/2022
5/7/2022
1
>=8.2.5
Prometheus
Description
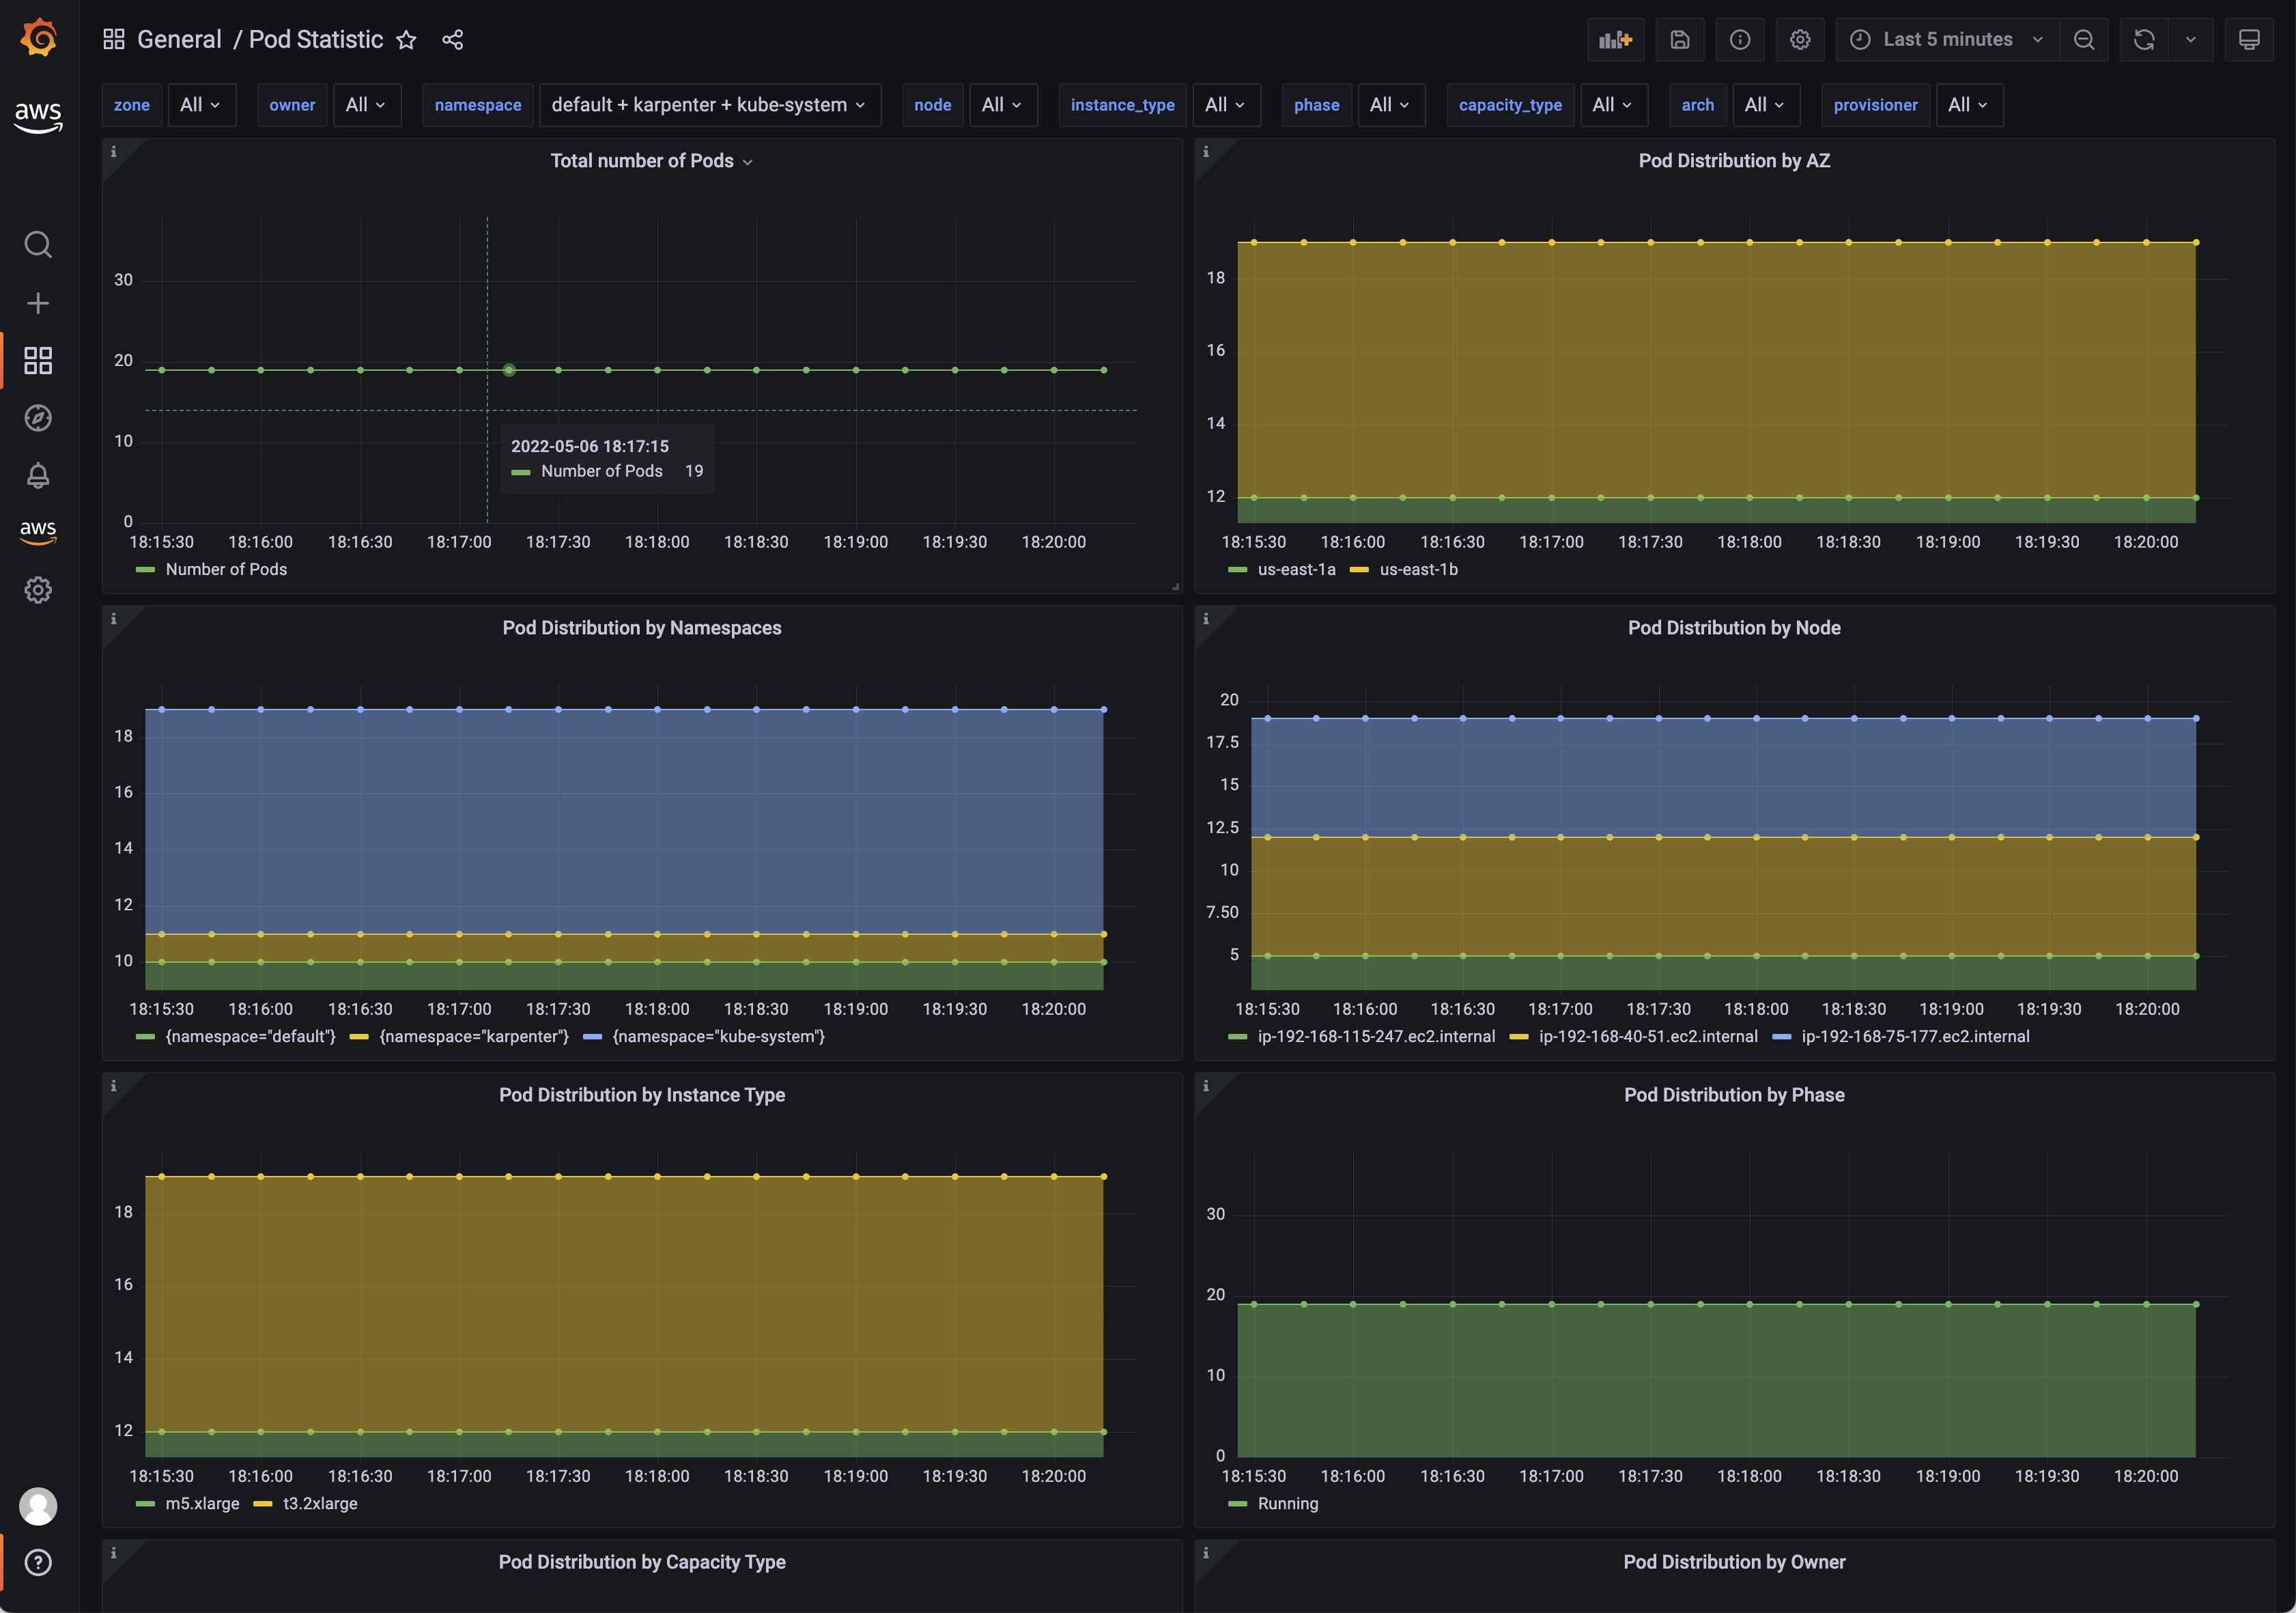
This dashboard monitors pod-level status and distribution in a Karpenter-managed cluster using karpenter_pods_state metrics. It highlights overall pod counts (Total number of Pods) and breaks down allocation across AZs, Namespaces, Nodes, and Instance Types with distribution panels such as Pod Distribution by AZ, Pod Distribution by Namespaces, and Pod Distribution by Node. The views emphasize pod phase distribution and capacity-type breakdown to help diagnose scheduling efficiency and resource provisioning, with concise visualizations for ownership and workload placement through panels like Pod Distribution by Owner and Pod Distribution by Capacity Type.
Screenshots
Used Metrics 11
karpenter_pods_state
Get Dashboard✕
Download
Copy to Clipboard