Pi-hole UI 2,3932,393 1.0 (1 reviews)
5/21/2021
5/21/2021
4
>=7.5.7
Prometheus
Description
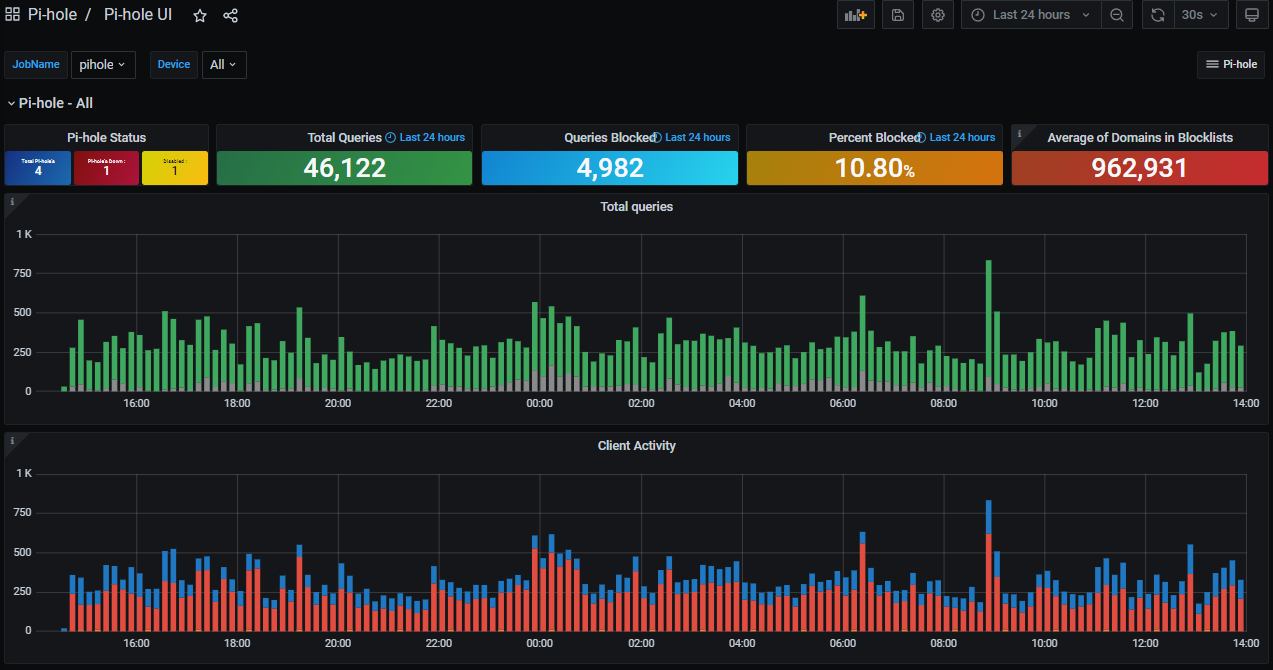
Watch either a single Pi-hole system or combine the statics of several in a single pane.
Screenshots
Used Metrics 1111
PiholeDevices
pihole_ads_blocked_today
pihole_dns_queries_today
pihole_domains_being_blocked
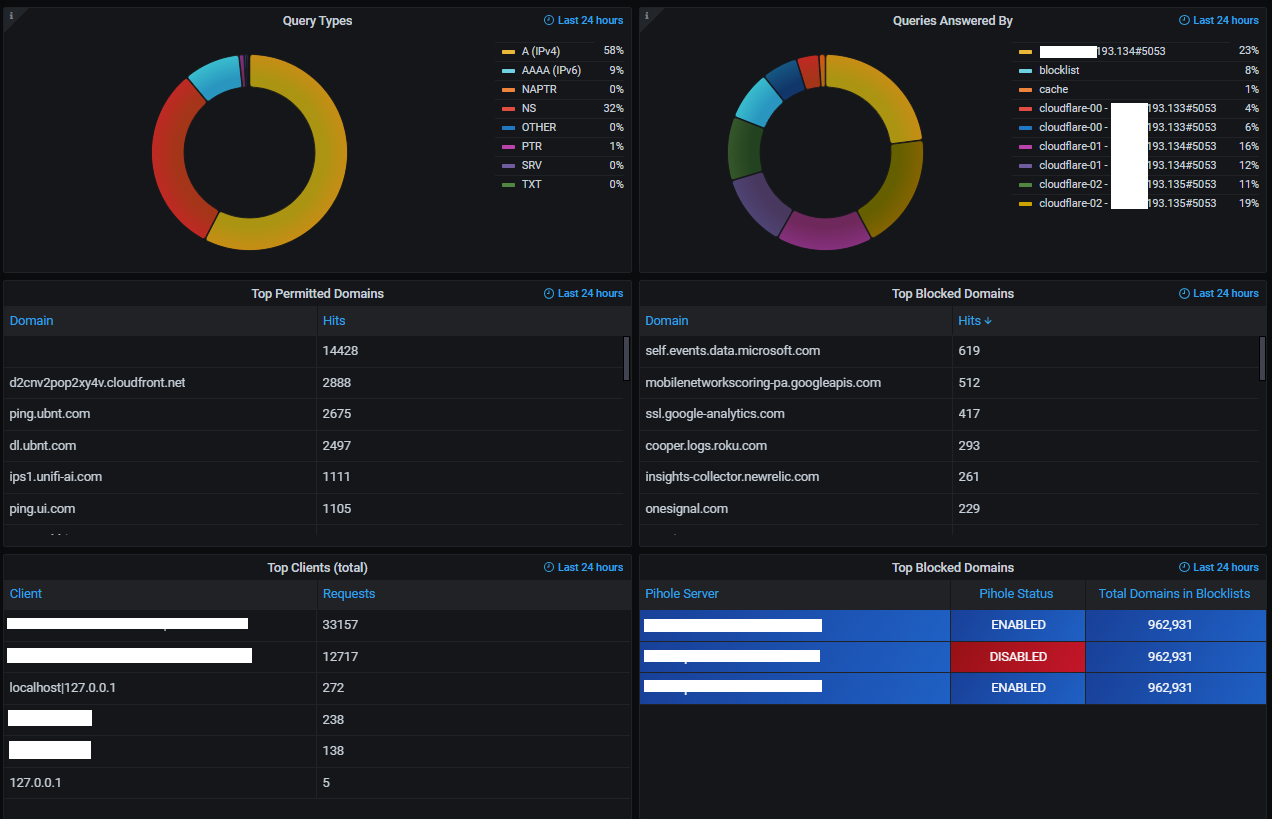
pihole_forward_destinations
pihole_queries_forwarded
pihole_querytypes
pihole_status
pihole_top_ads
pihole_top_queries
pihole_top_sources
Get Dashboard✕
Download
Copy to Clipboard