PI-Hole Exporter 790790 4.0 (1 reviews)
4/21/2021
4/21/2021
3
collectdDatabases
>=7.5.4
Prometheus
Description
This is a PI-Hole dashboard when using the https://github.com/eko/pihole-exporter Prometheus exporter
Screenshots
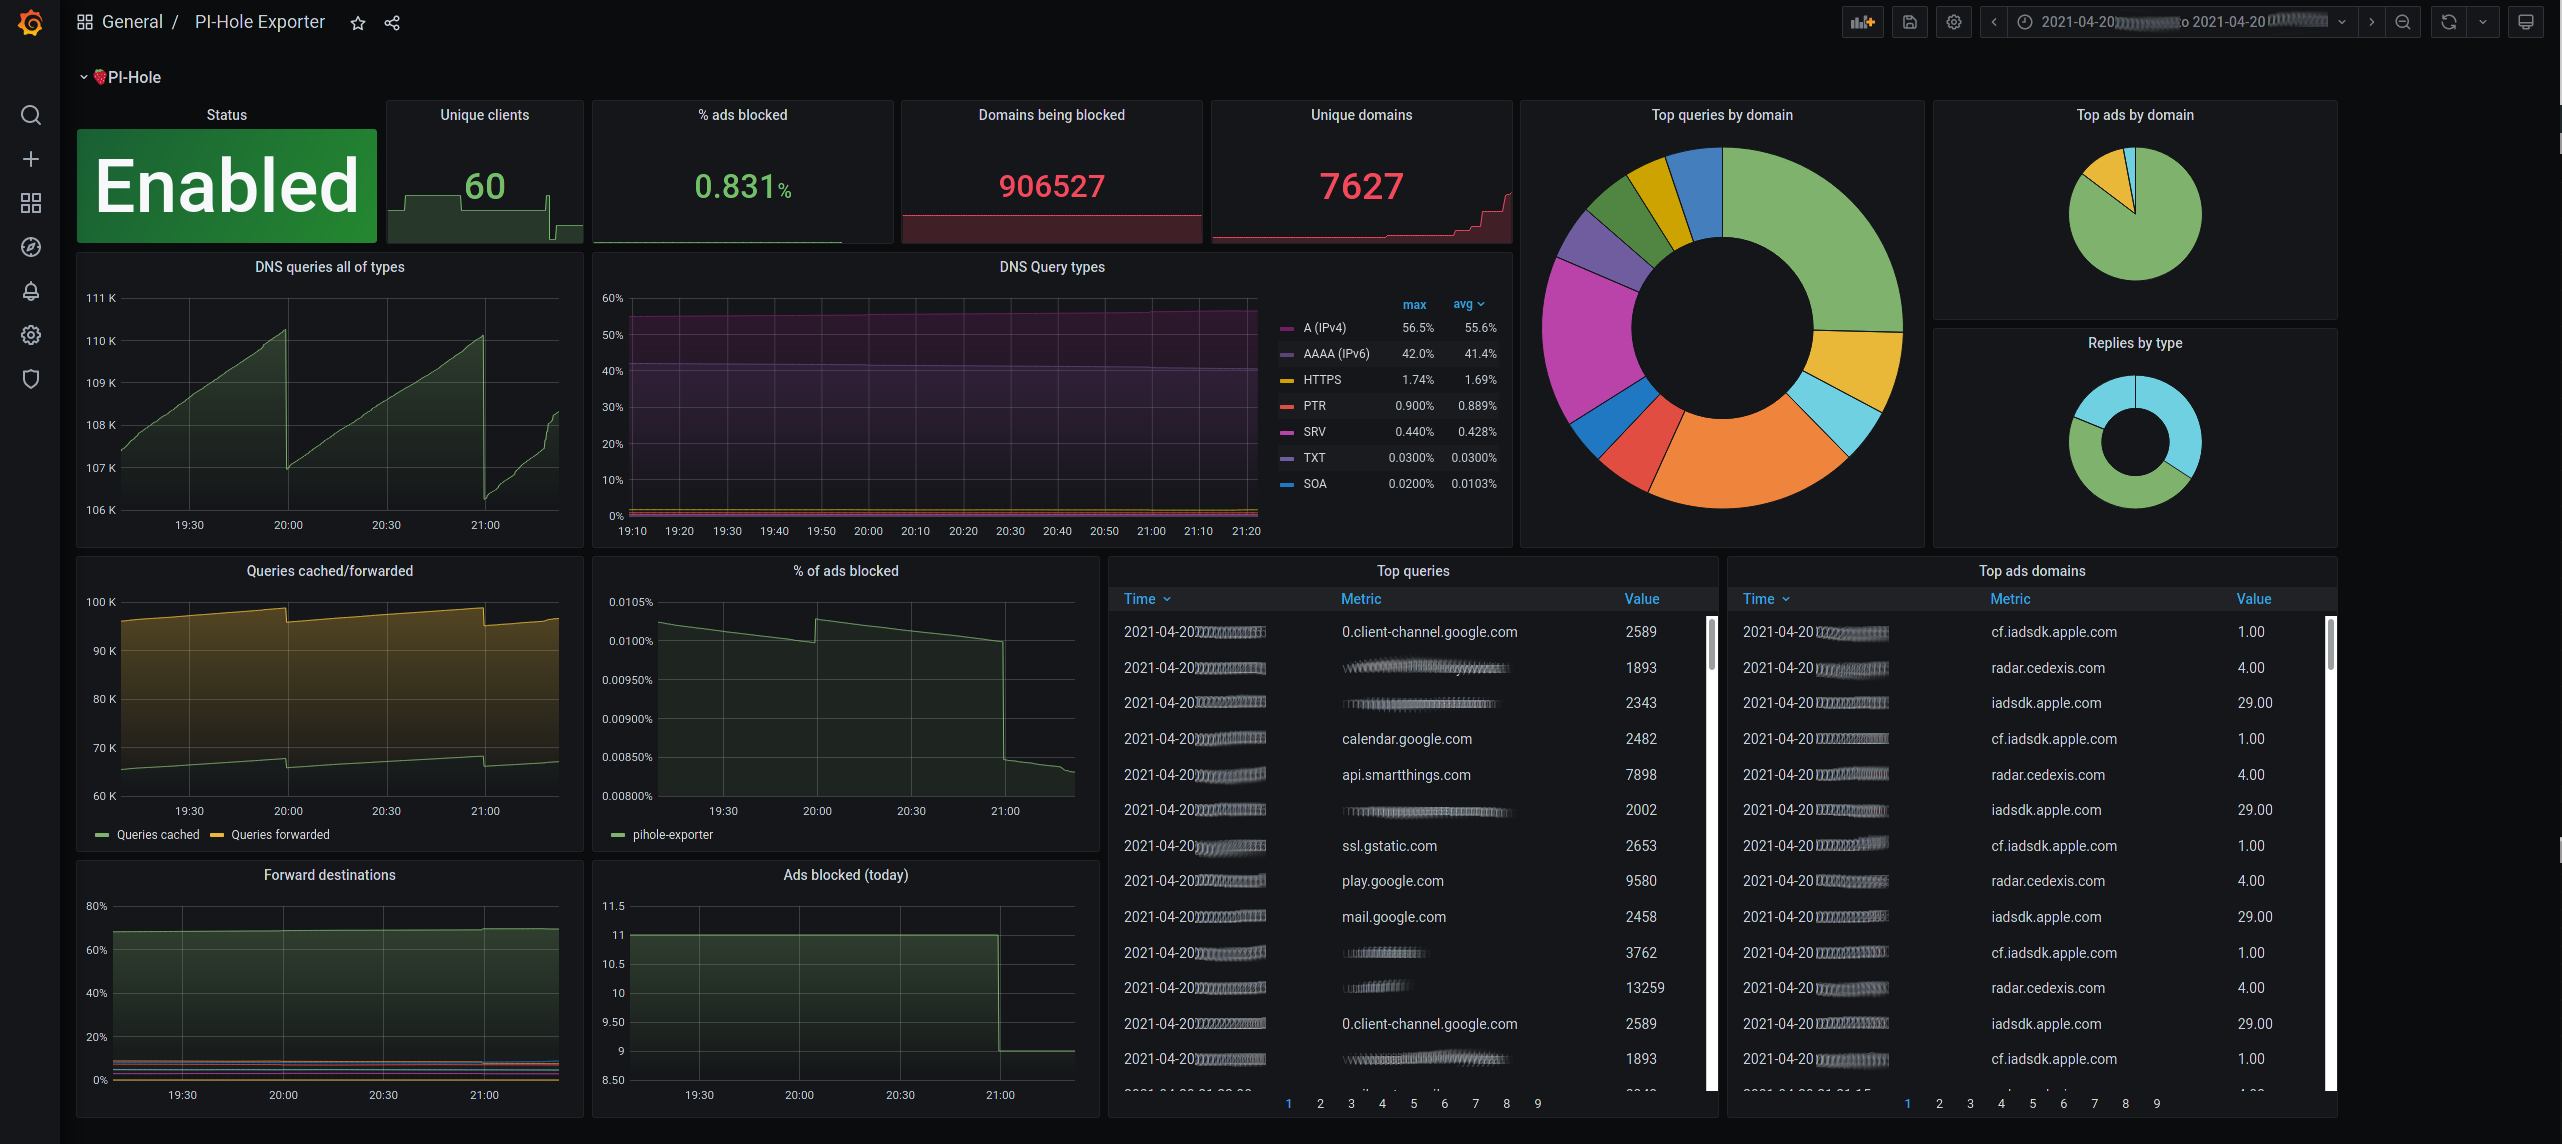
Used Metrics 1414
pihole_ads_blocked_today
pihole_ads_percentage_today
pihole_dns_queries_all_types
pihole_domains_being_blocked
pihole_forward_destinations
pihole_queries_cached
pihole_queries_forwarded
pihole_querytypes
pihole_reply
pihole_status
pihole_top_ads
pihole_top_queries
pihole_unique_clients
pihole_unique_domains
Get Dashboard✕
Download
Copy to Clipboard