pgSCV: PostgreSQL (NEW) 1,3561,356
7/1/2024
6/18/2025
14
Databases
>=11.5.0-219443
Prometheus
Description
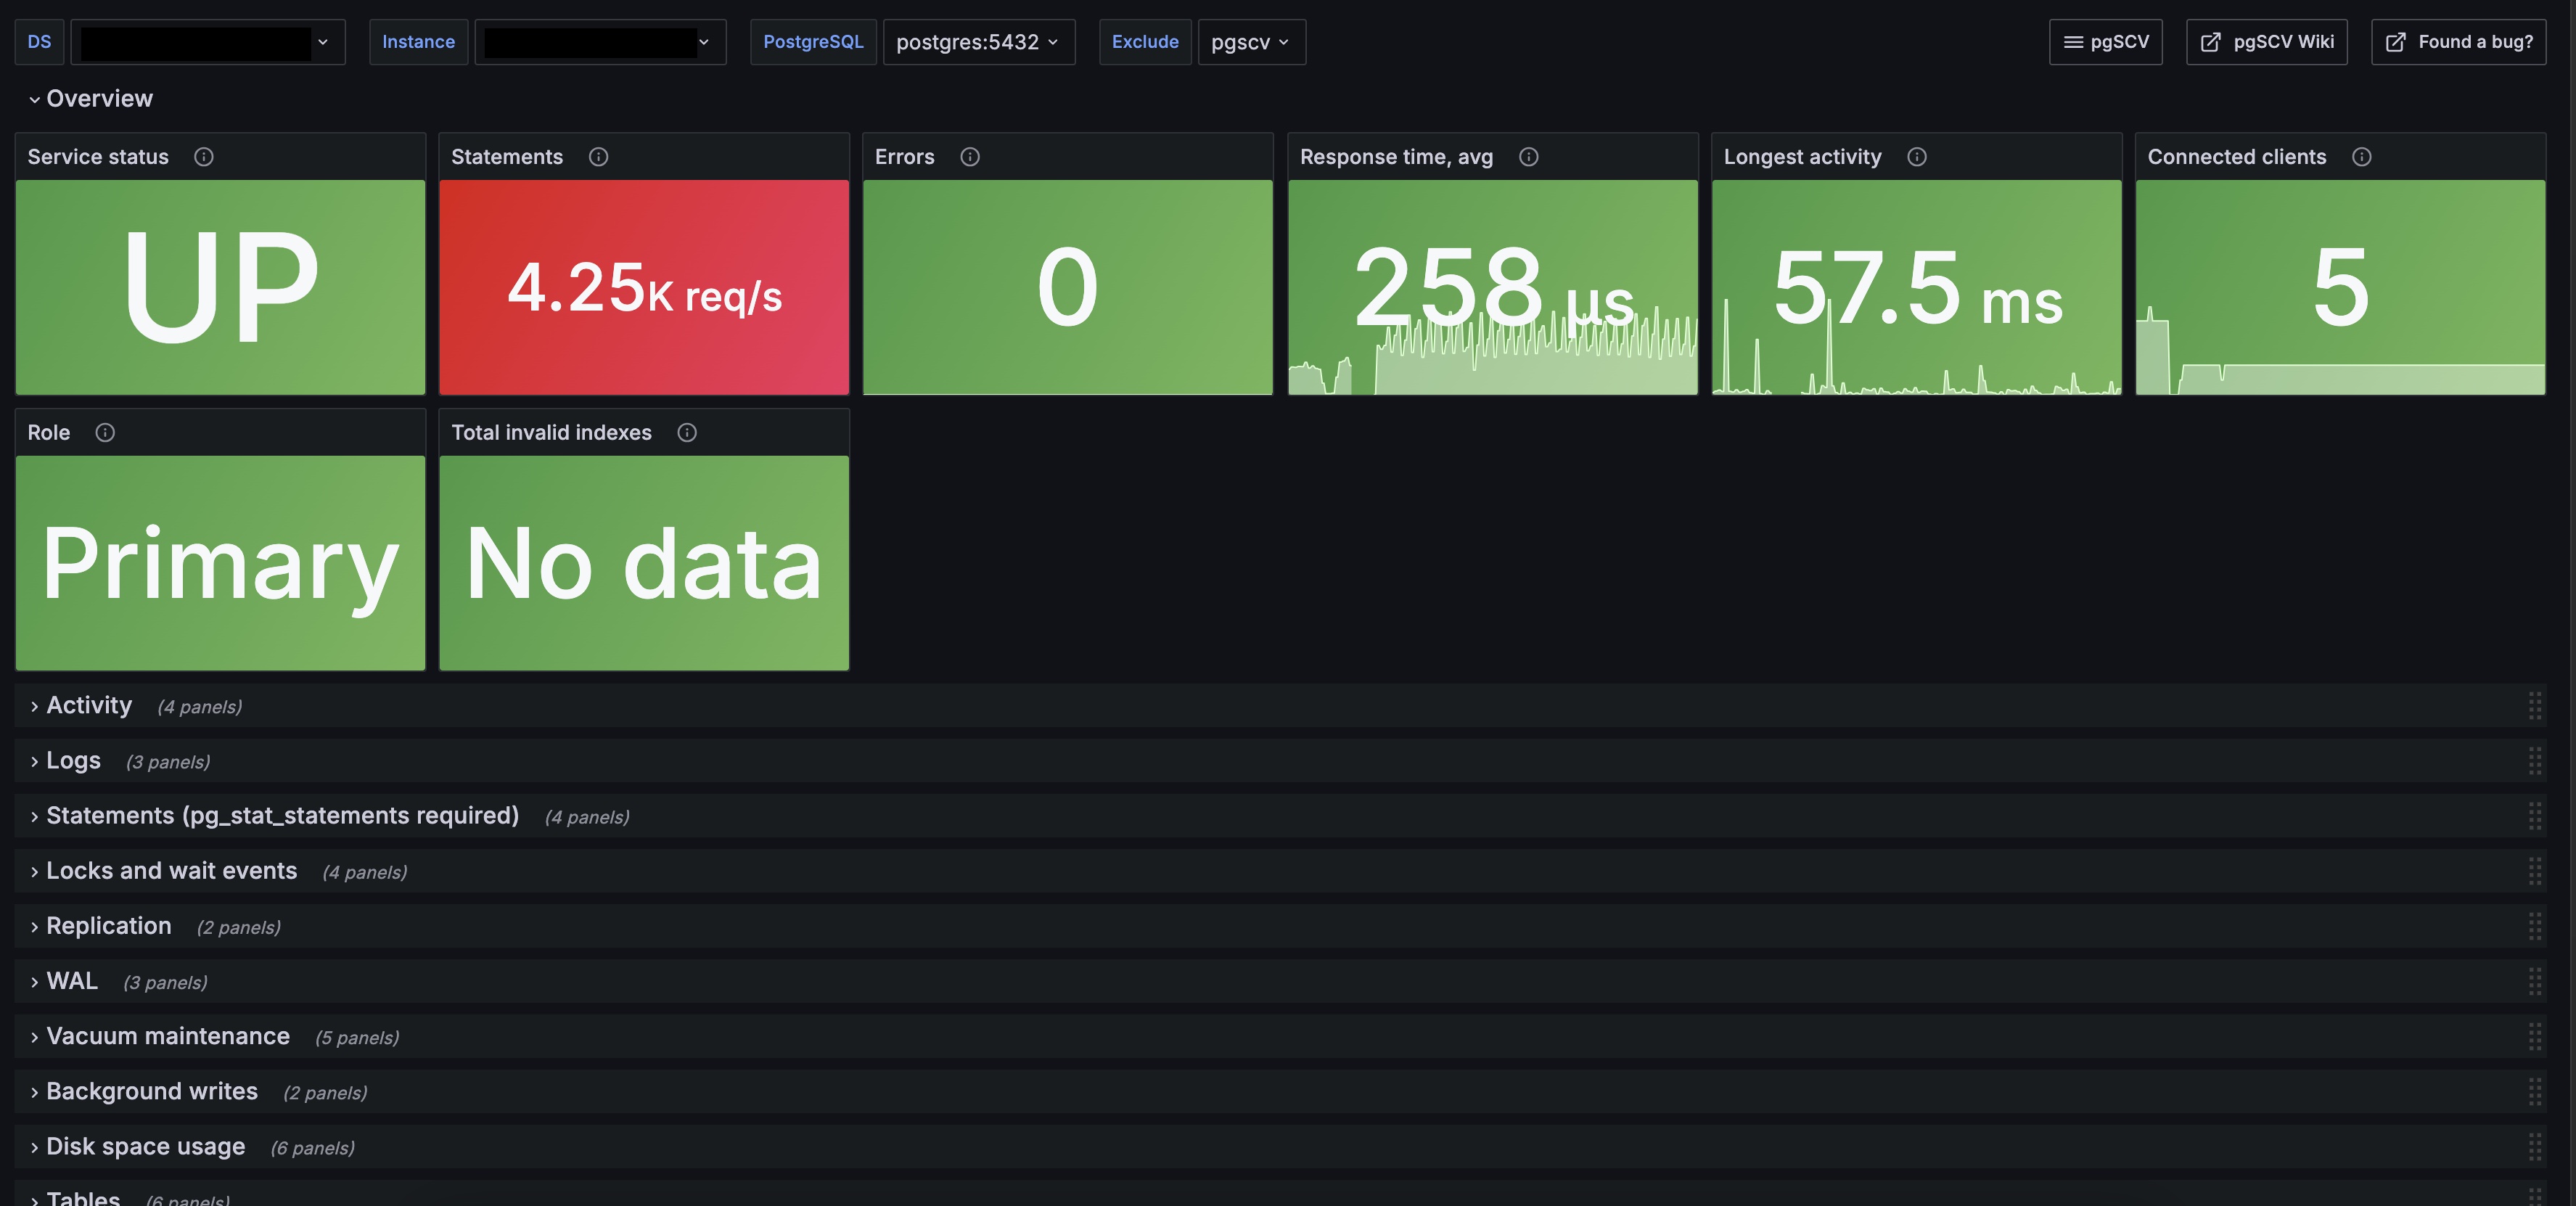
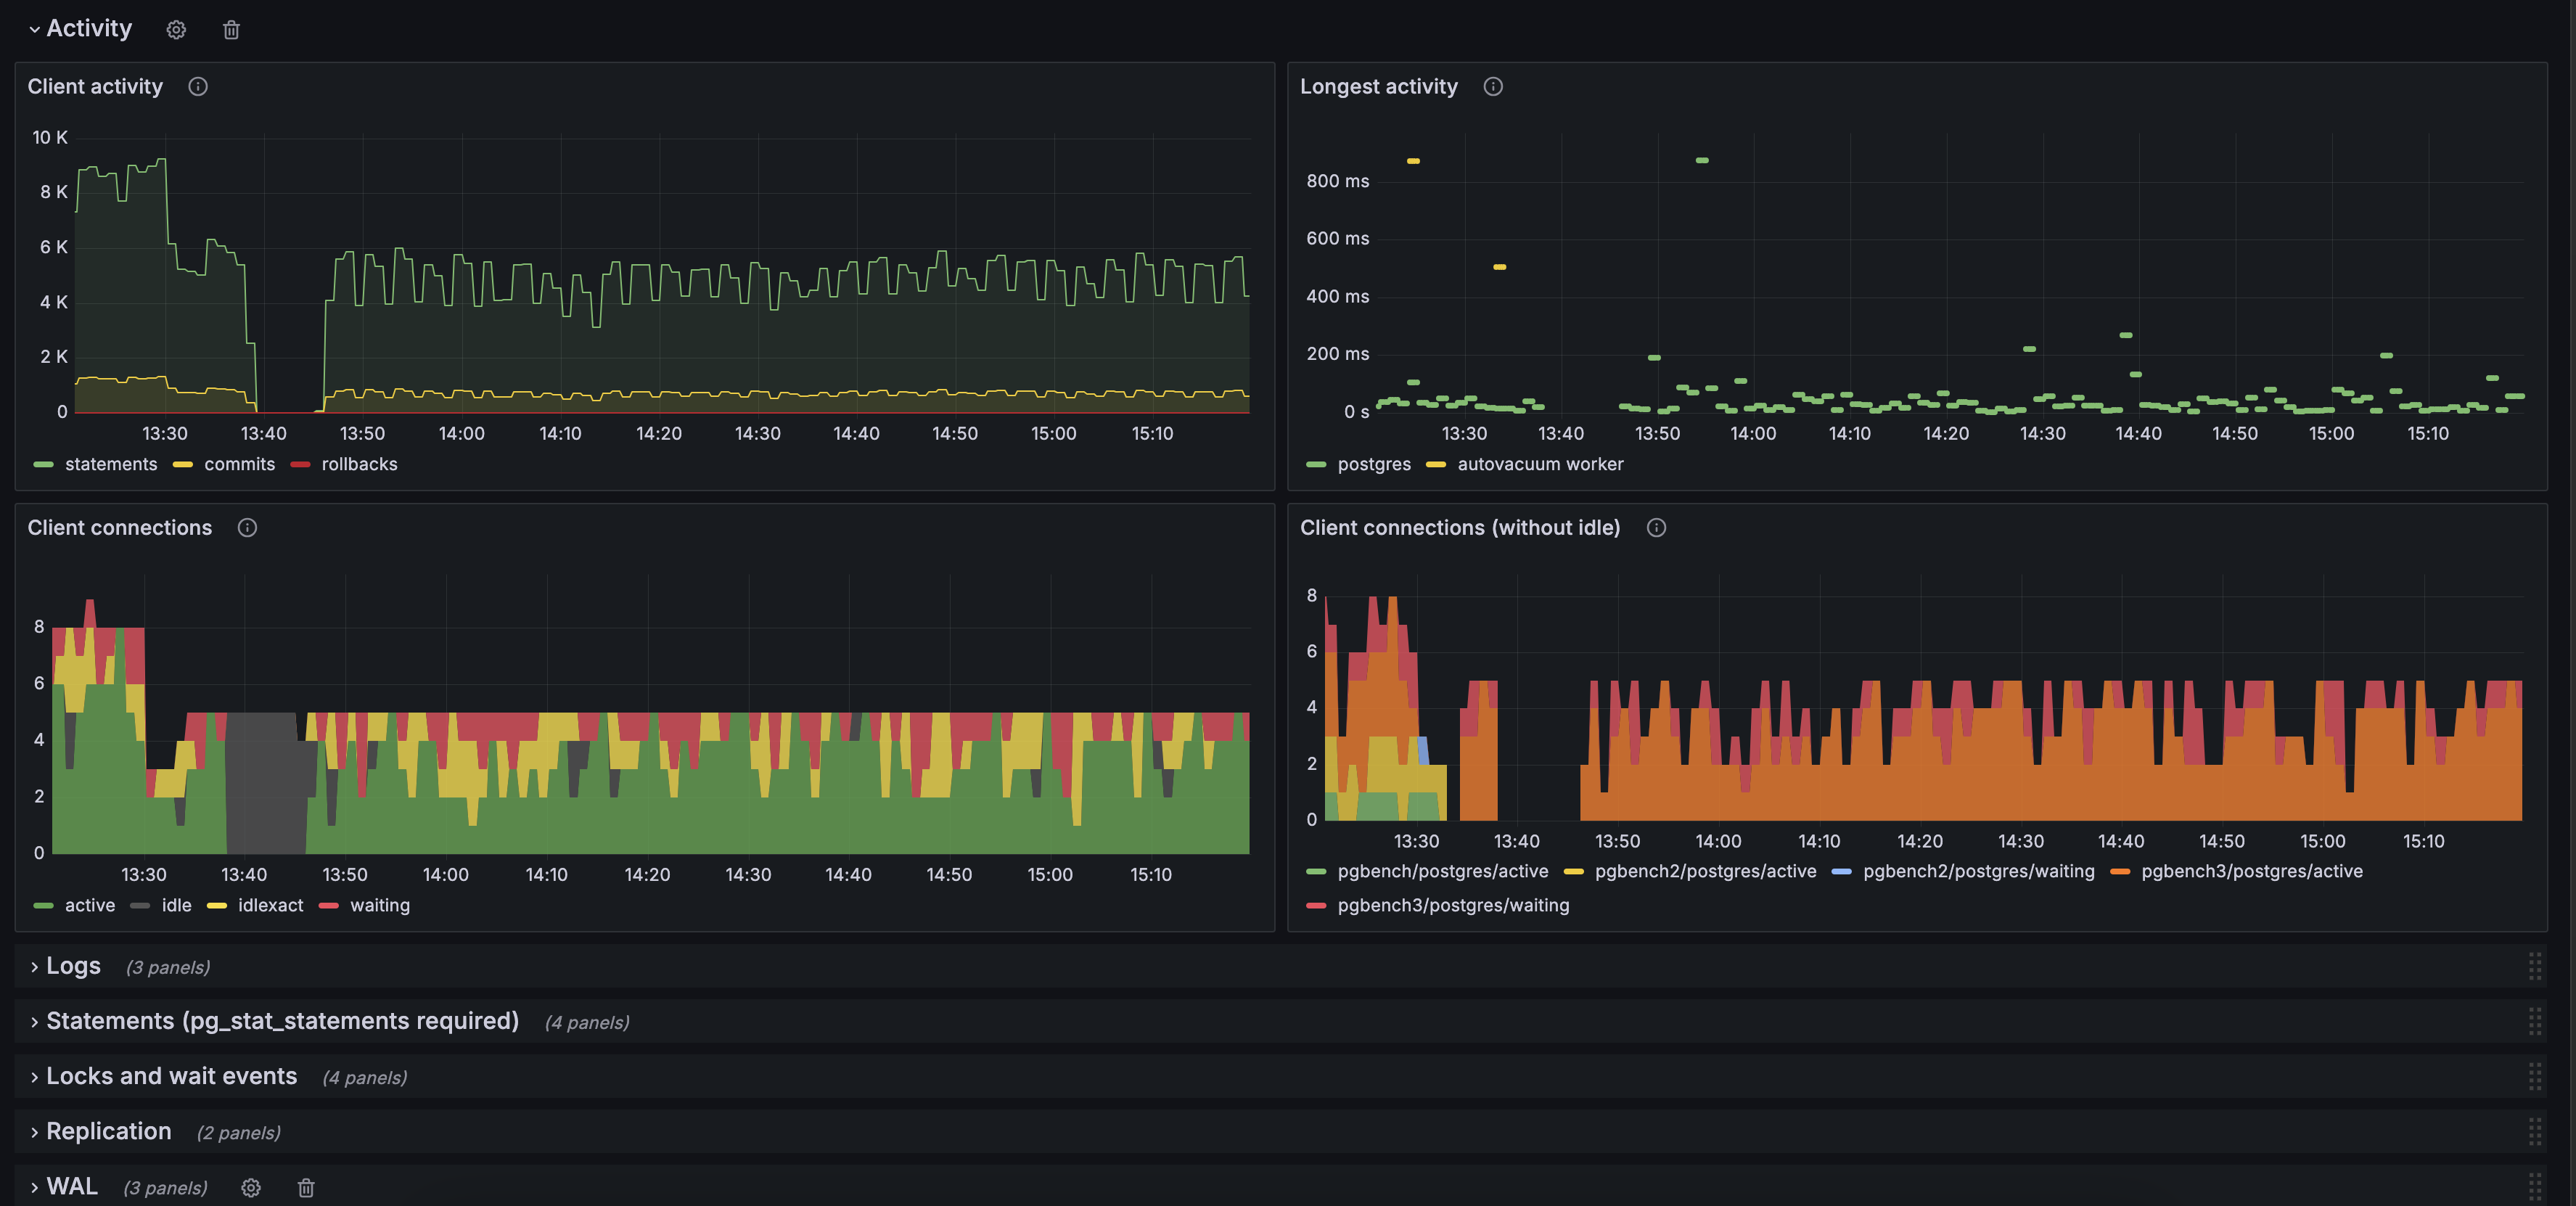
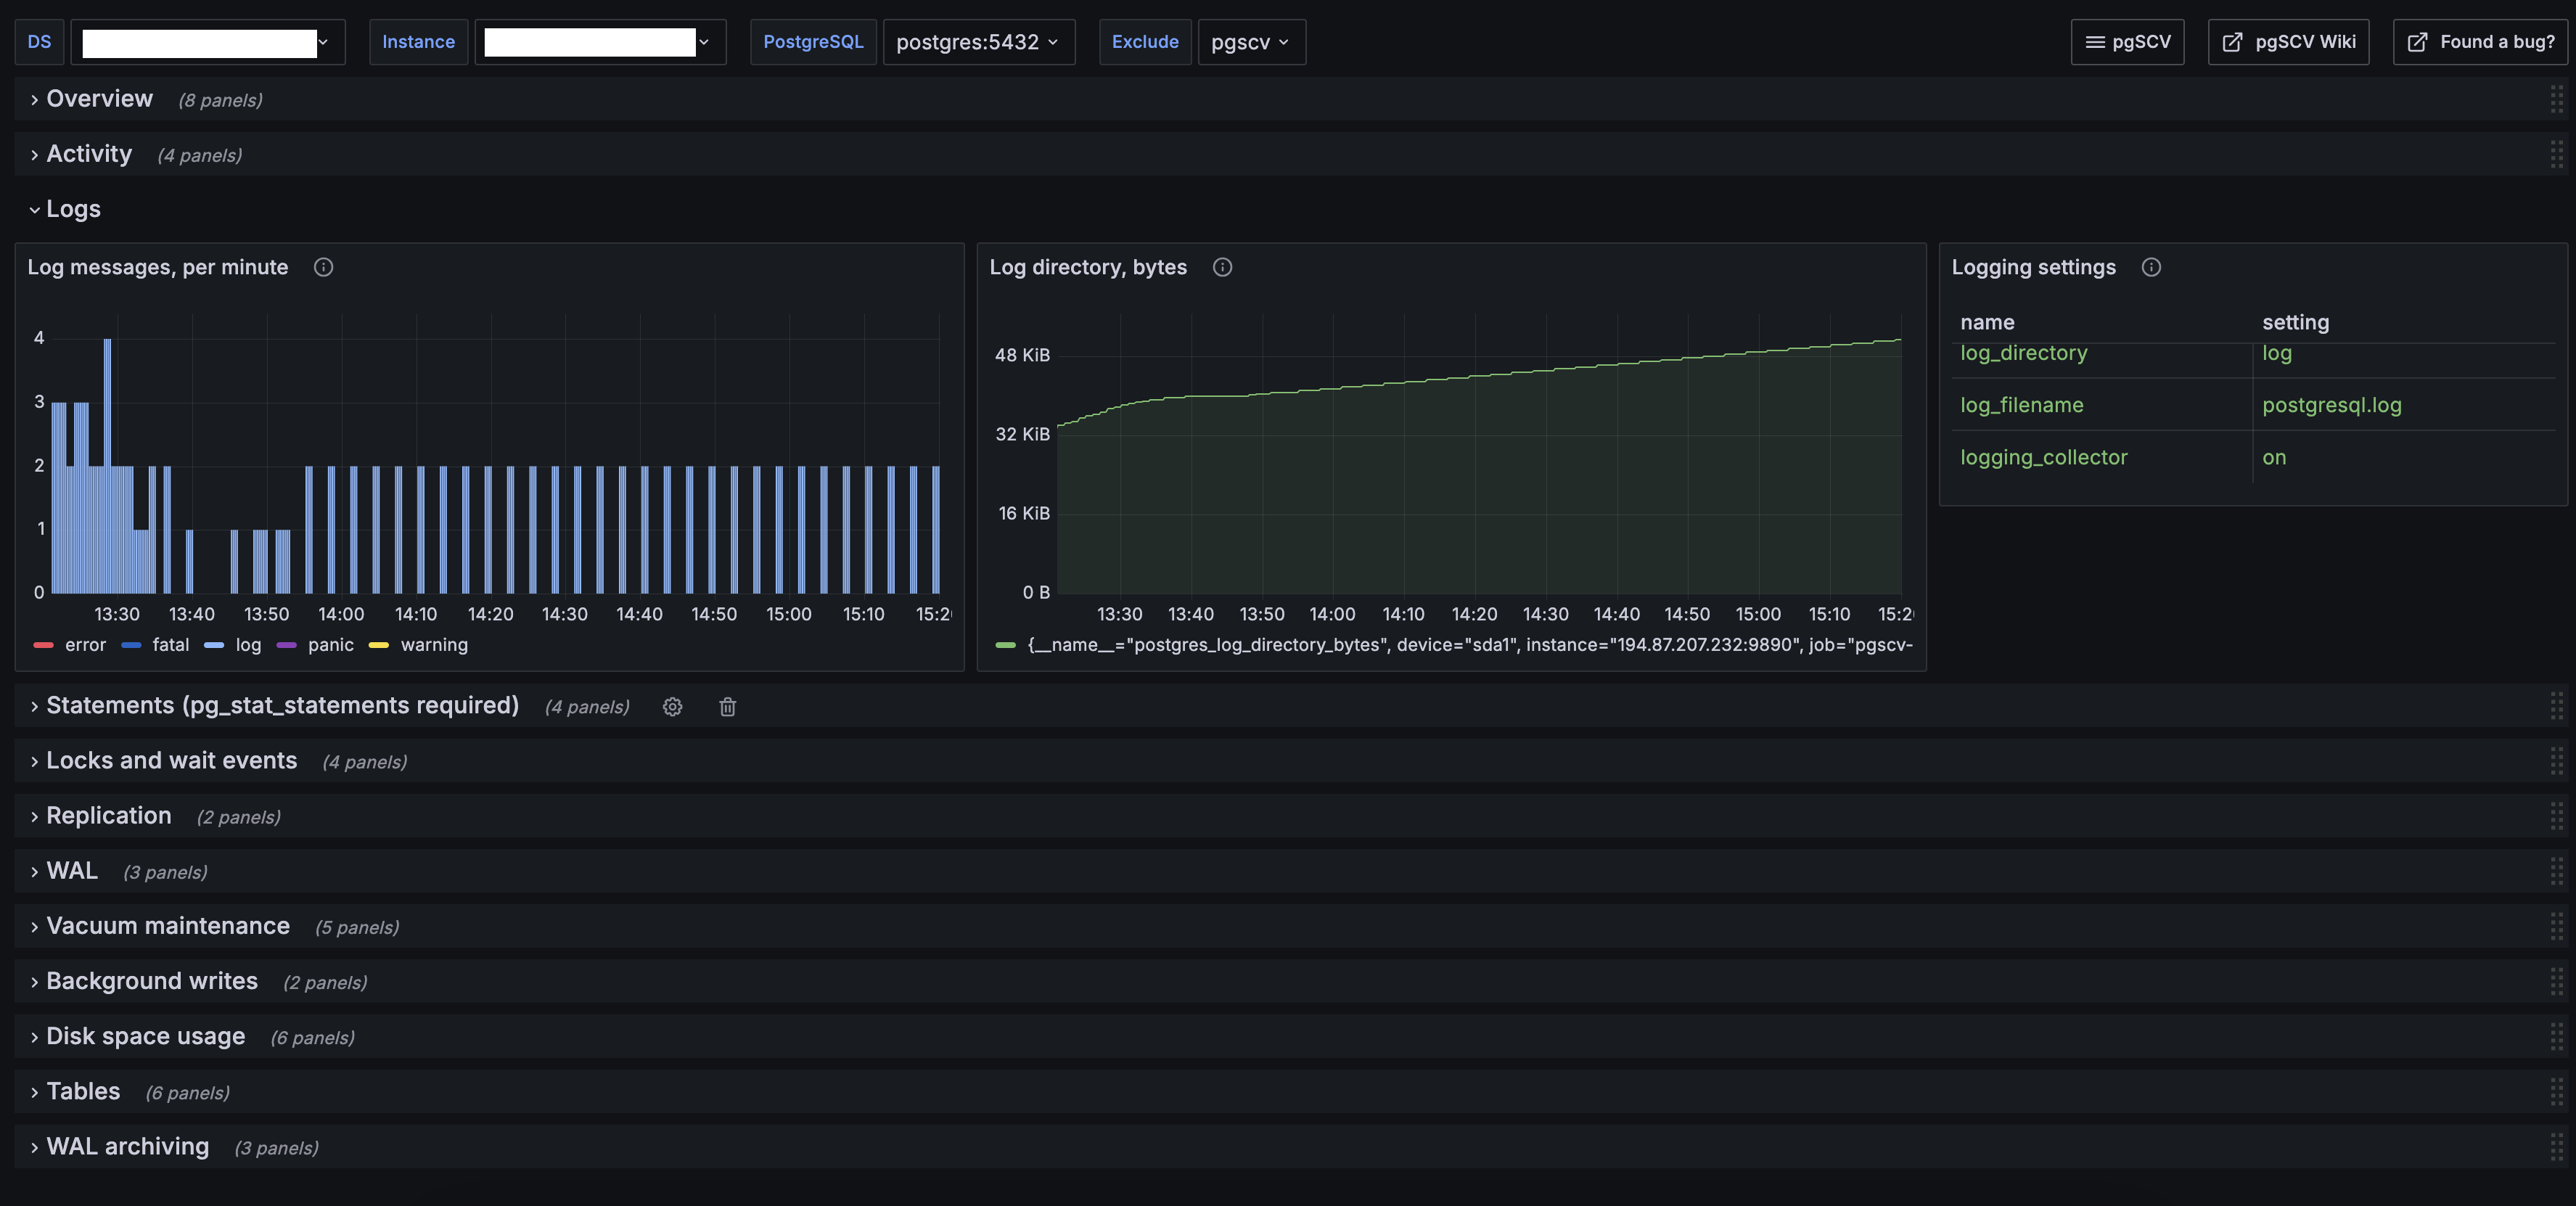
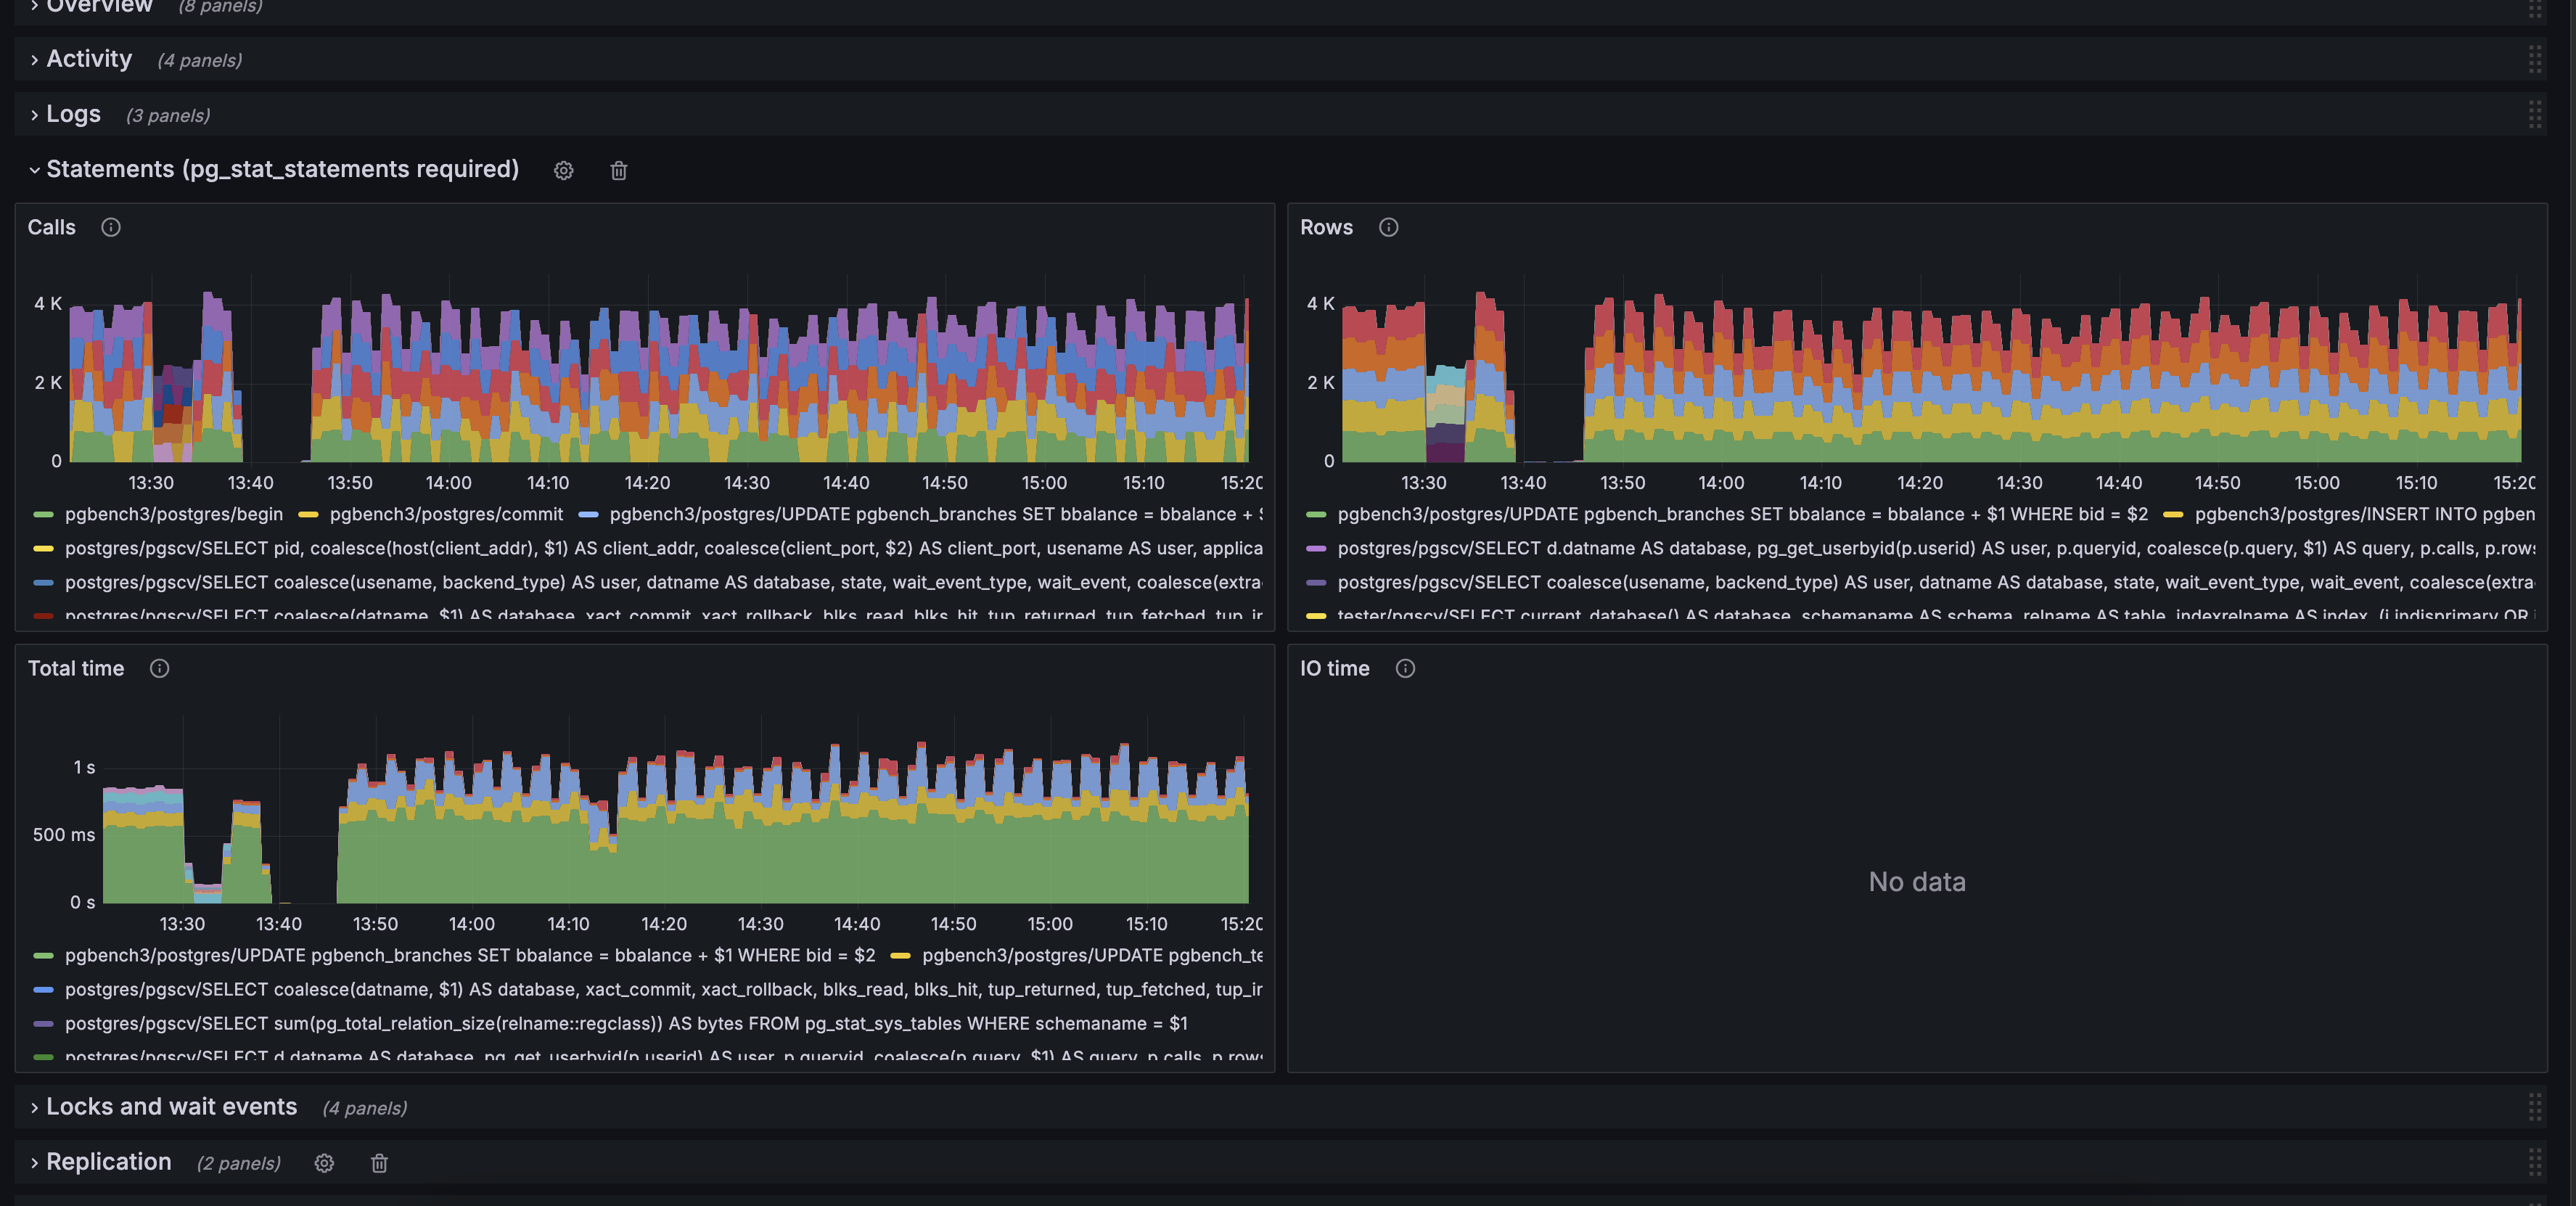
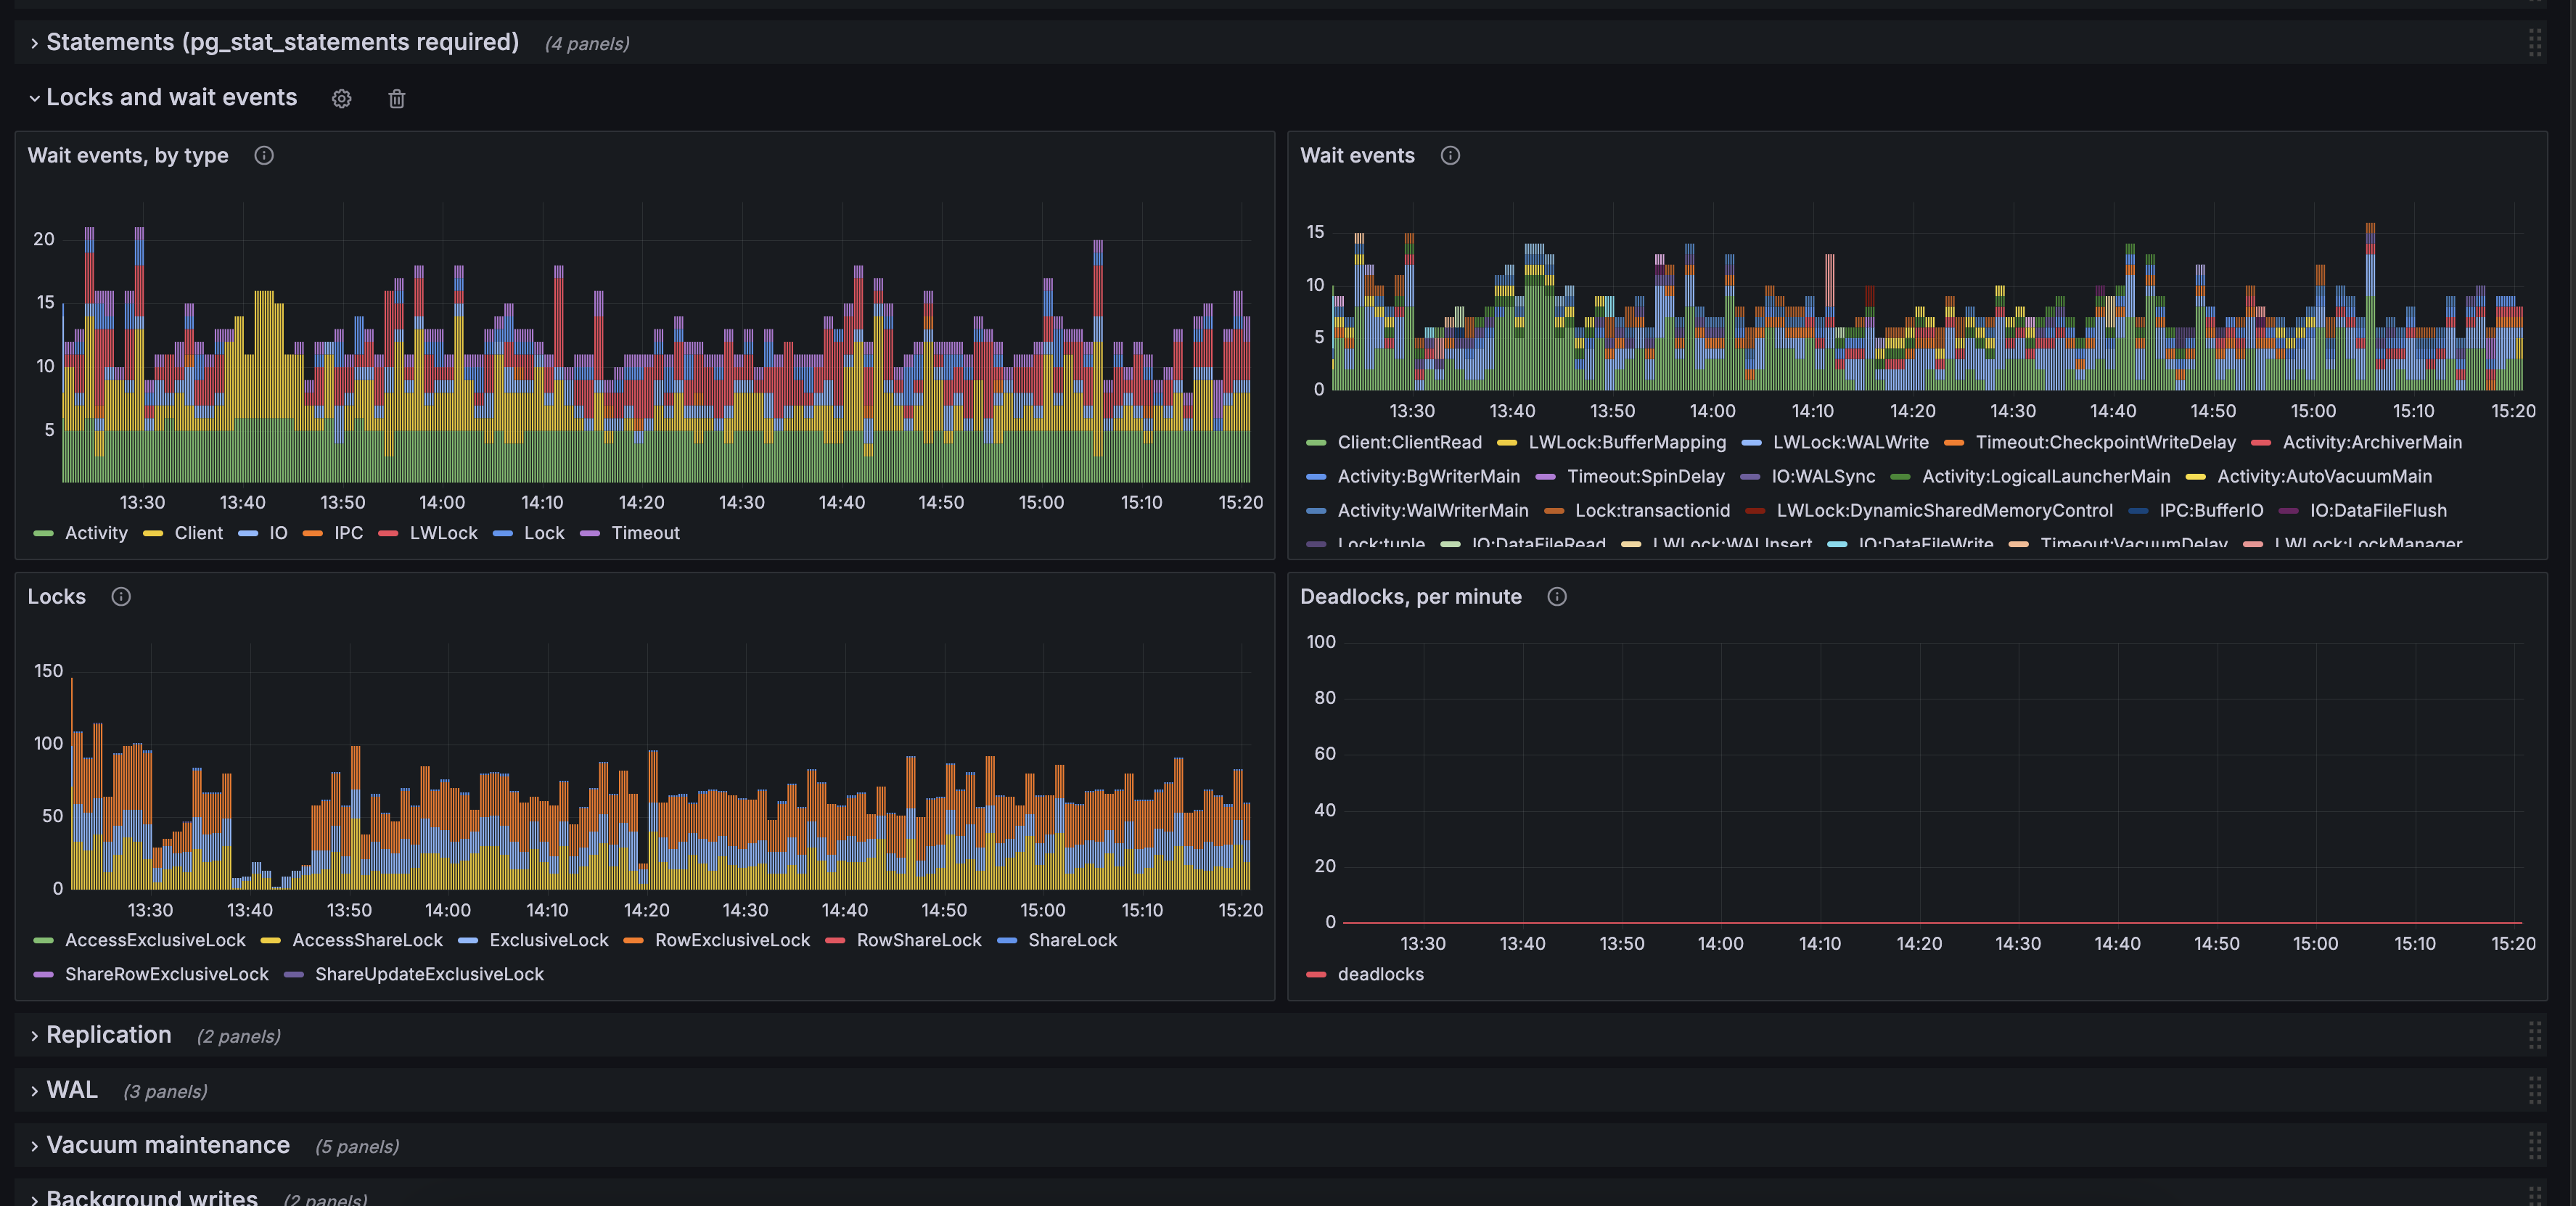
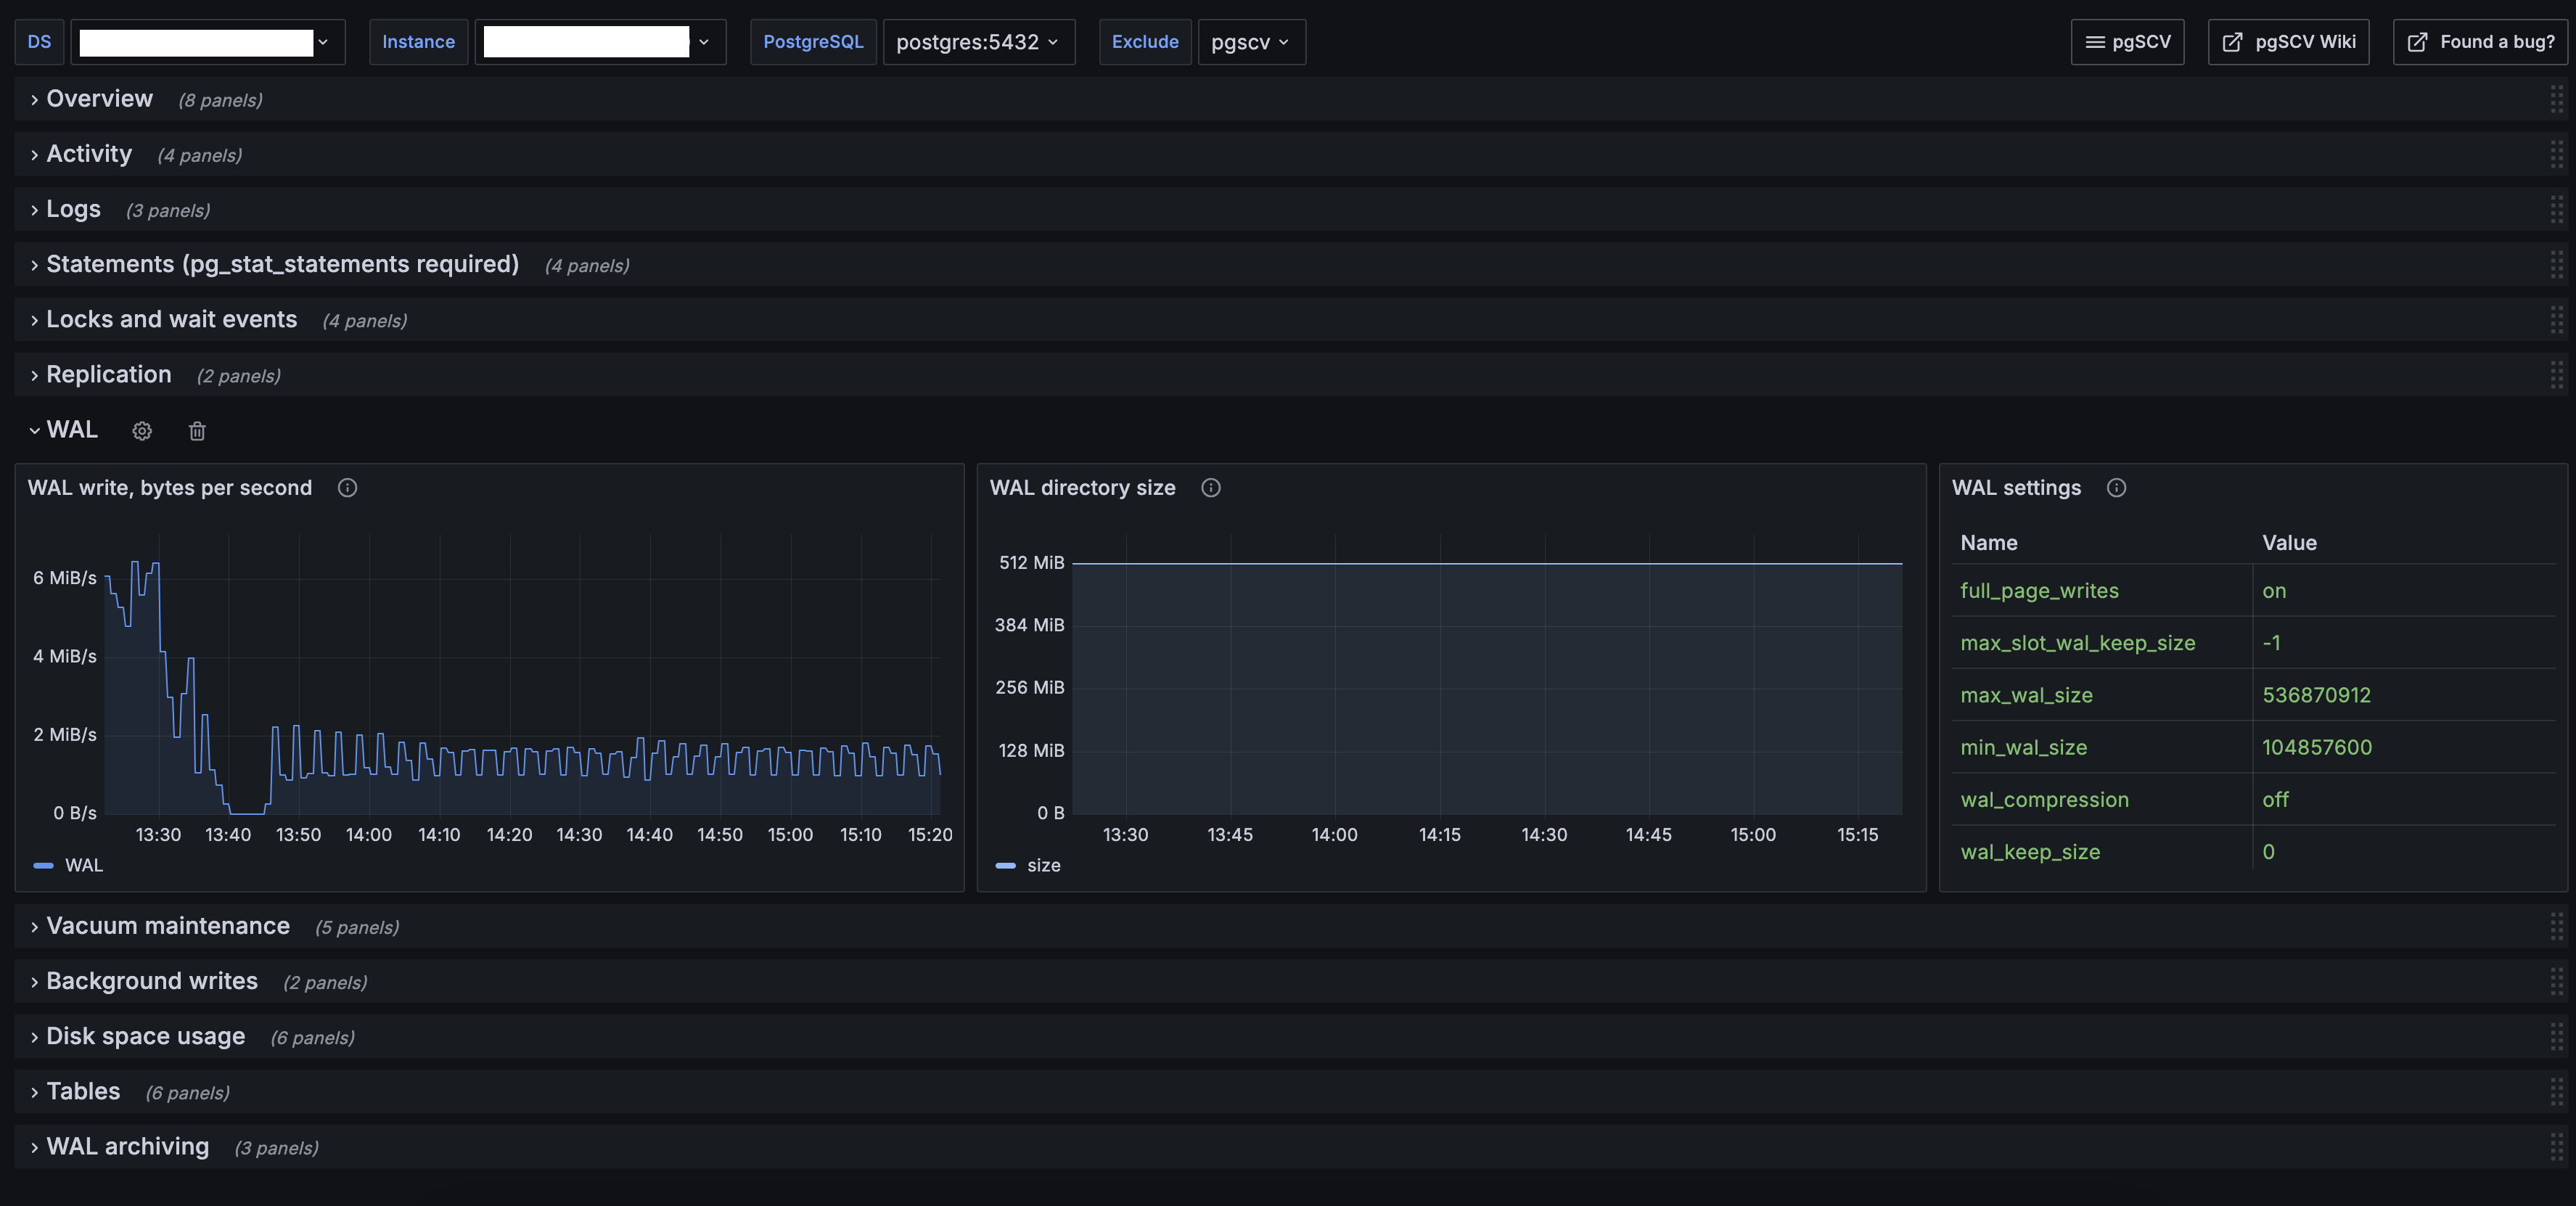
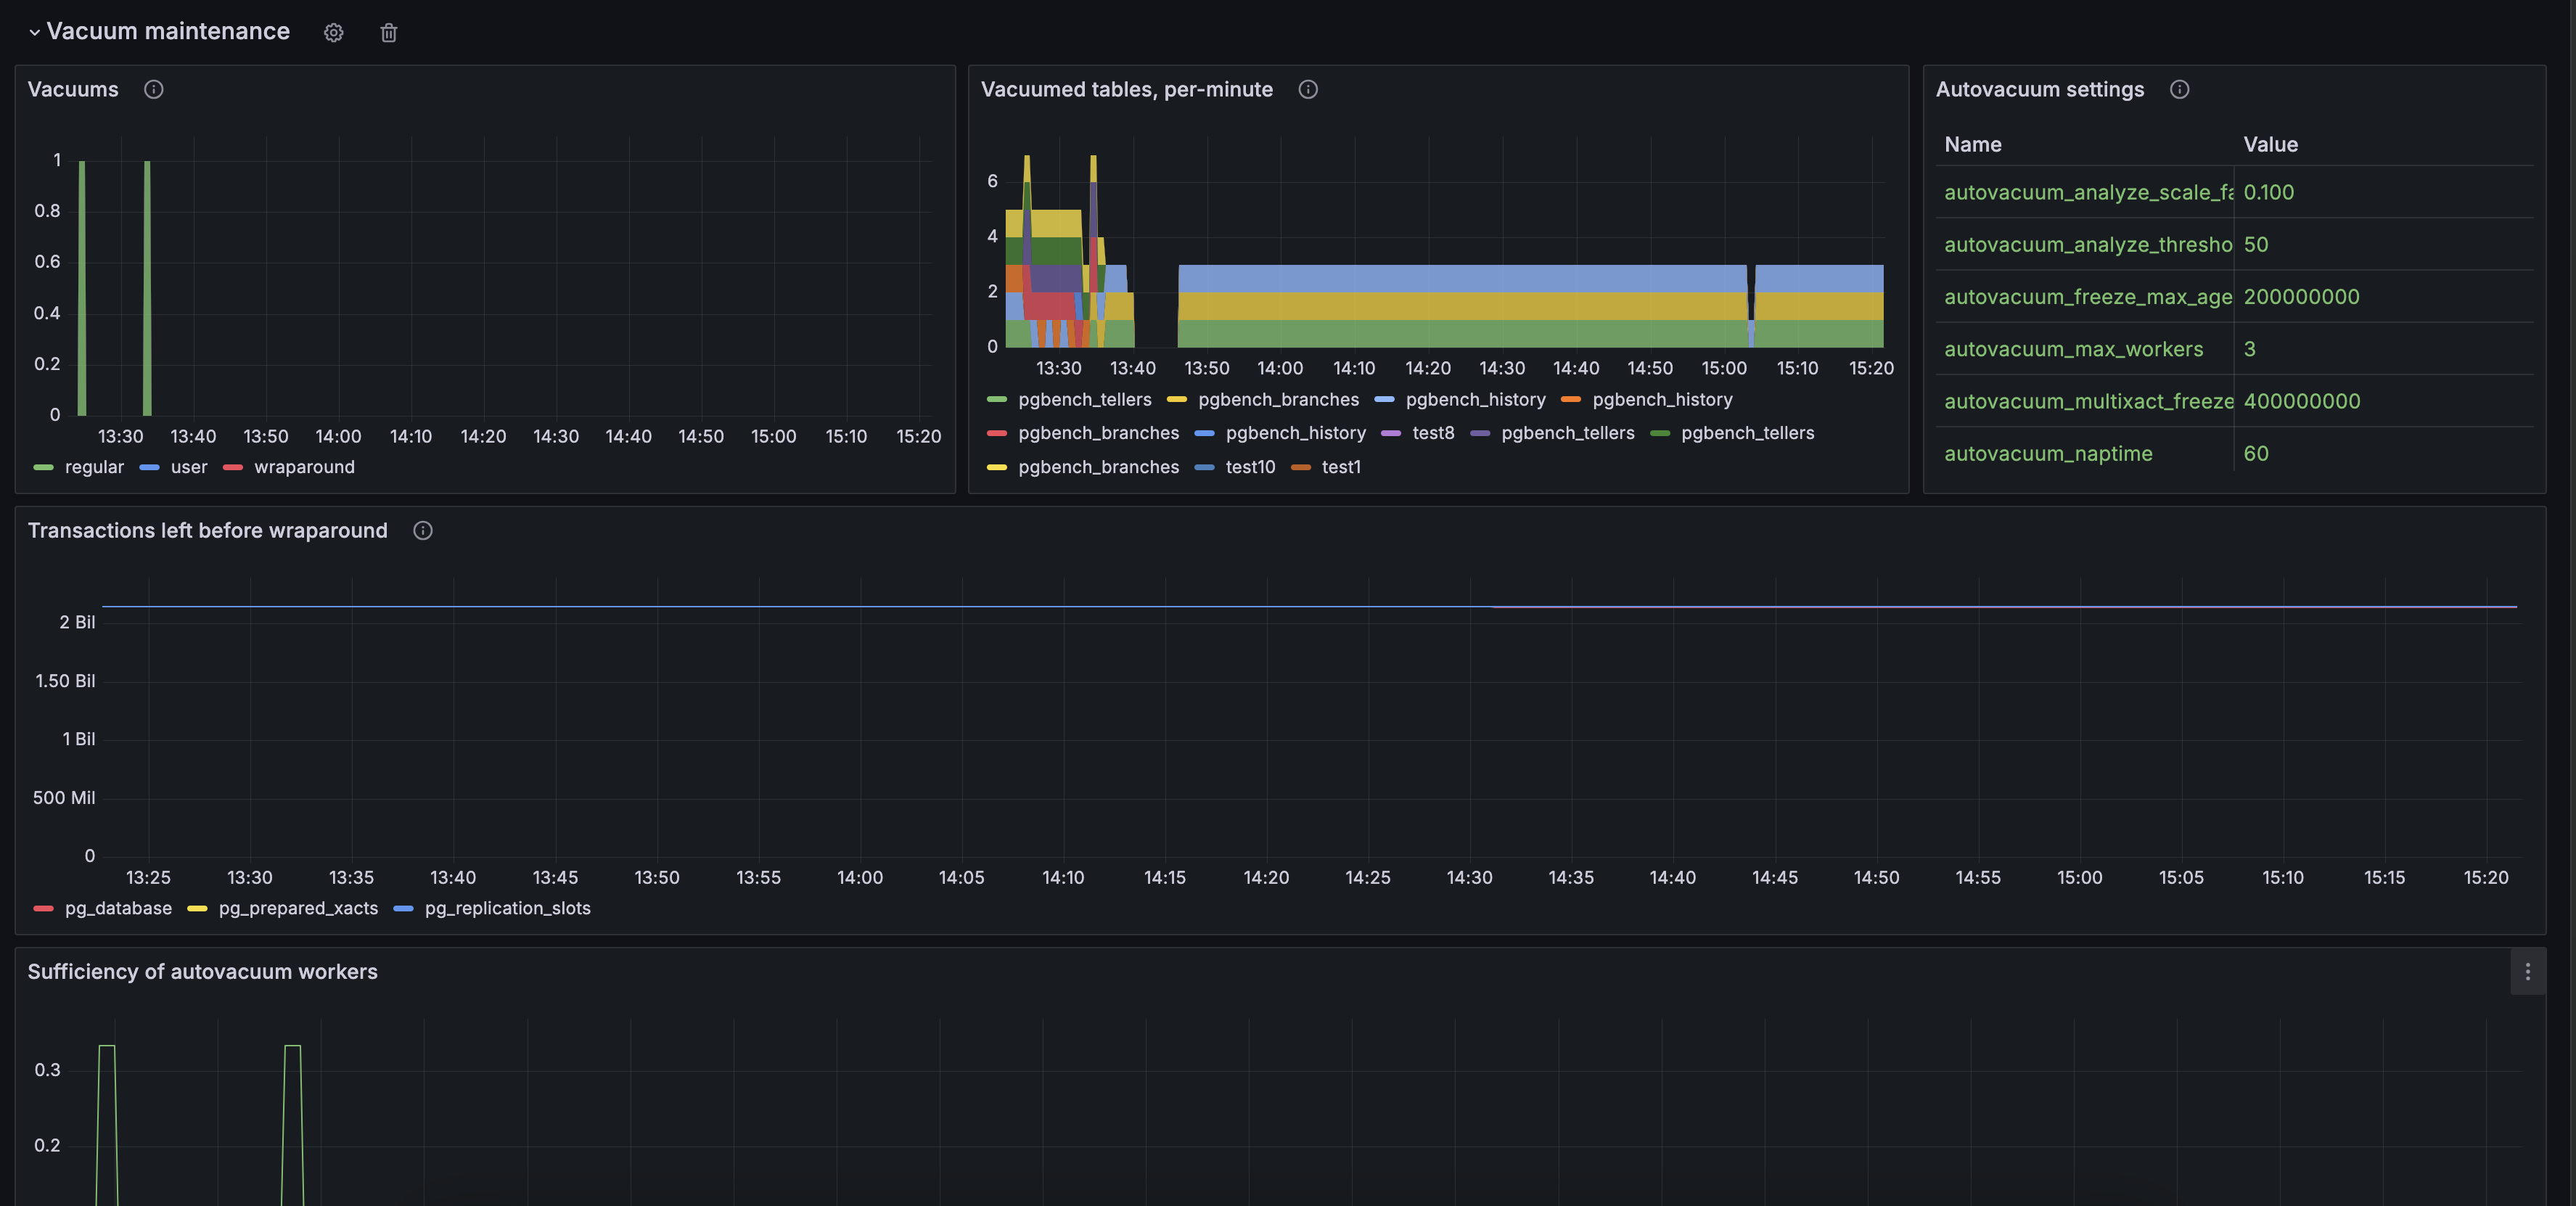
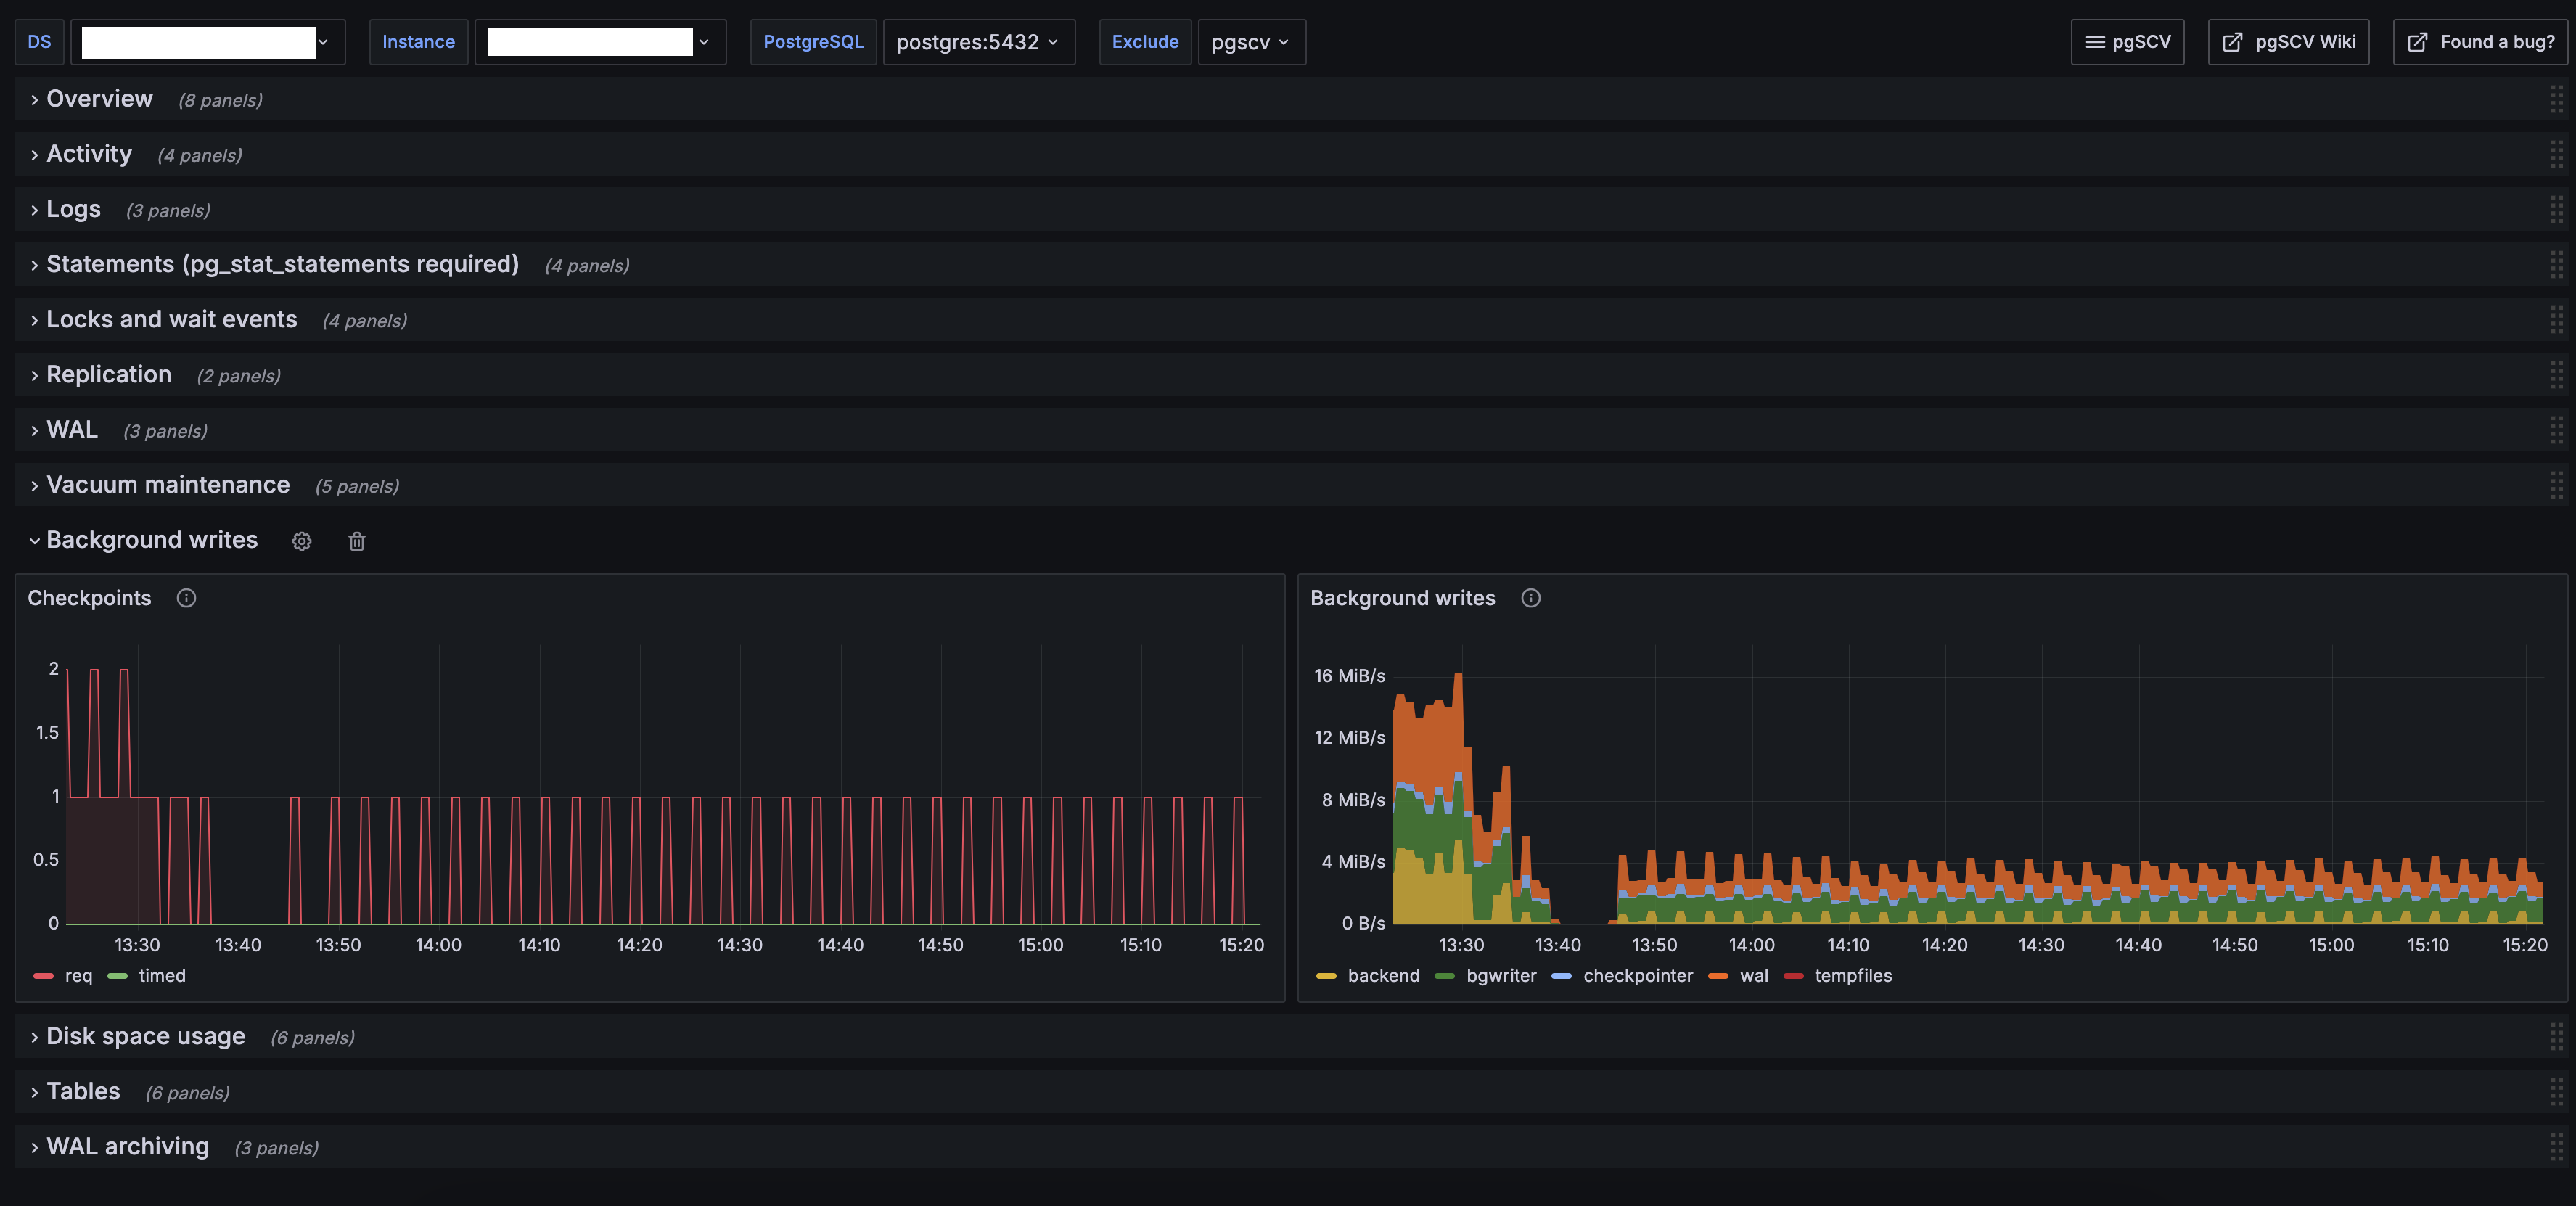
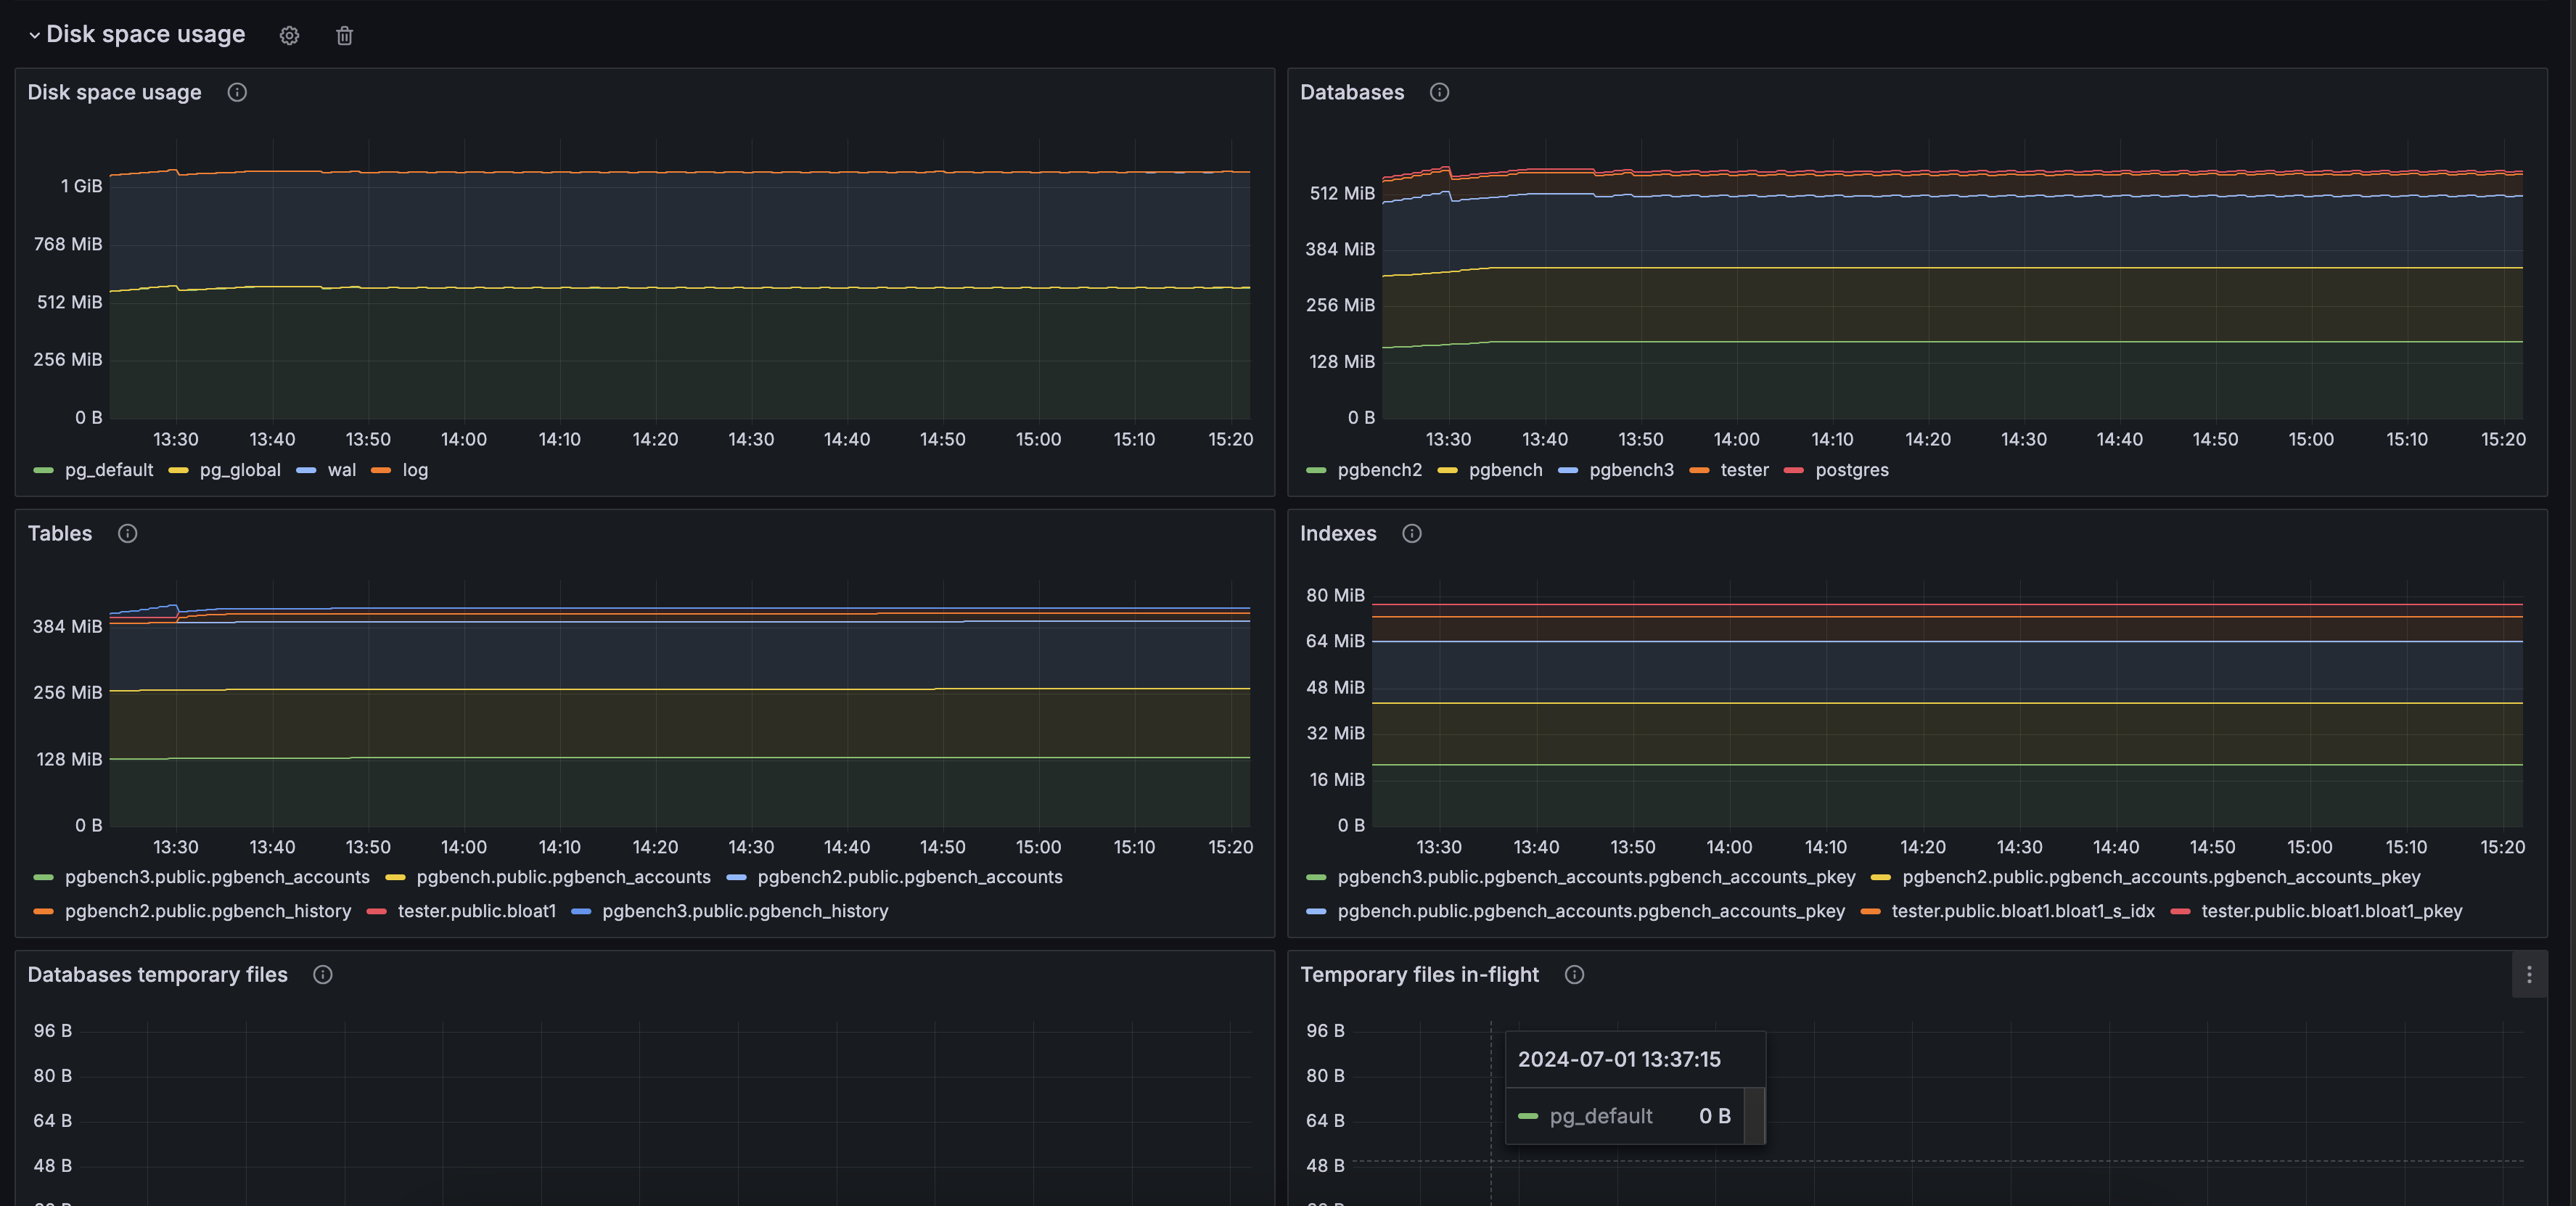
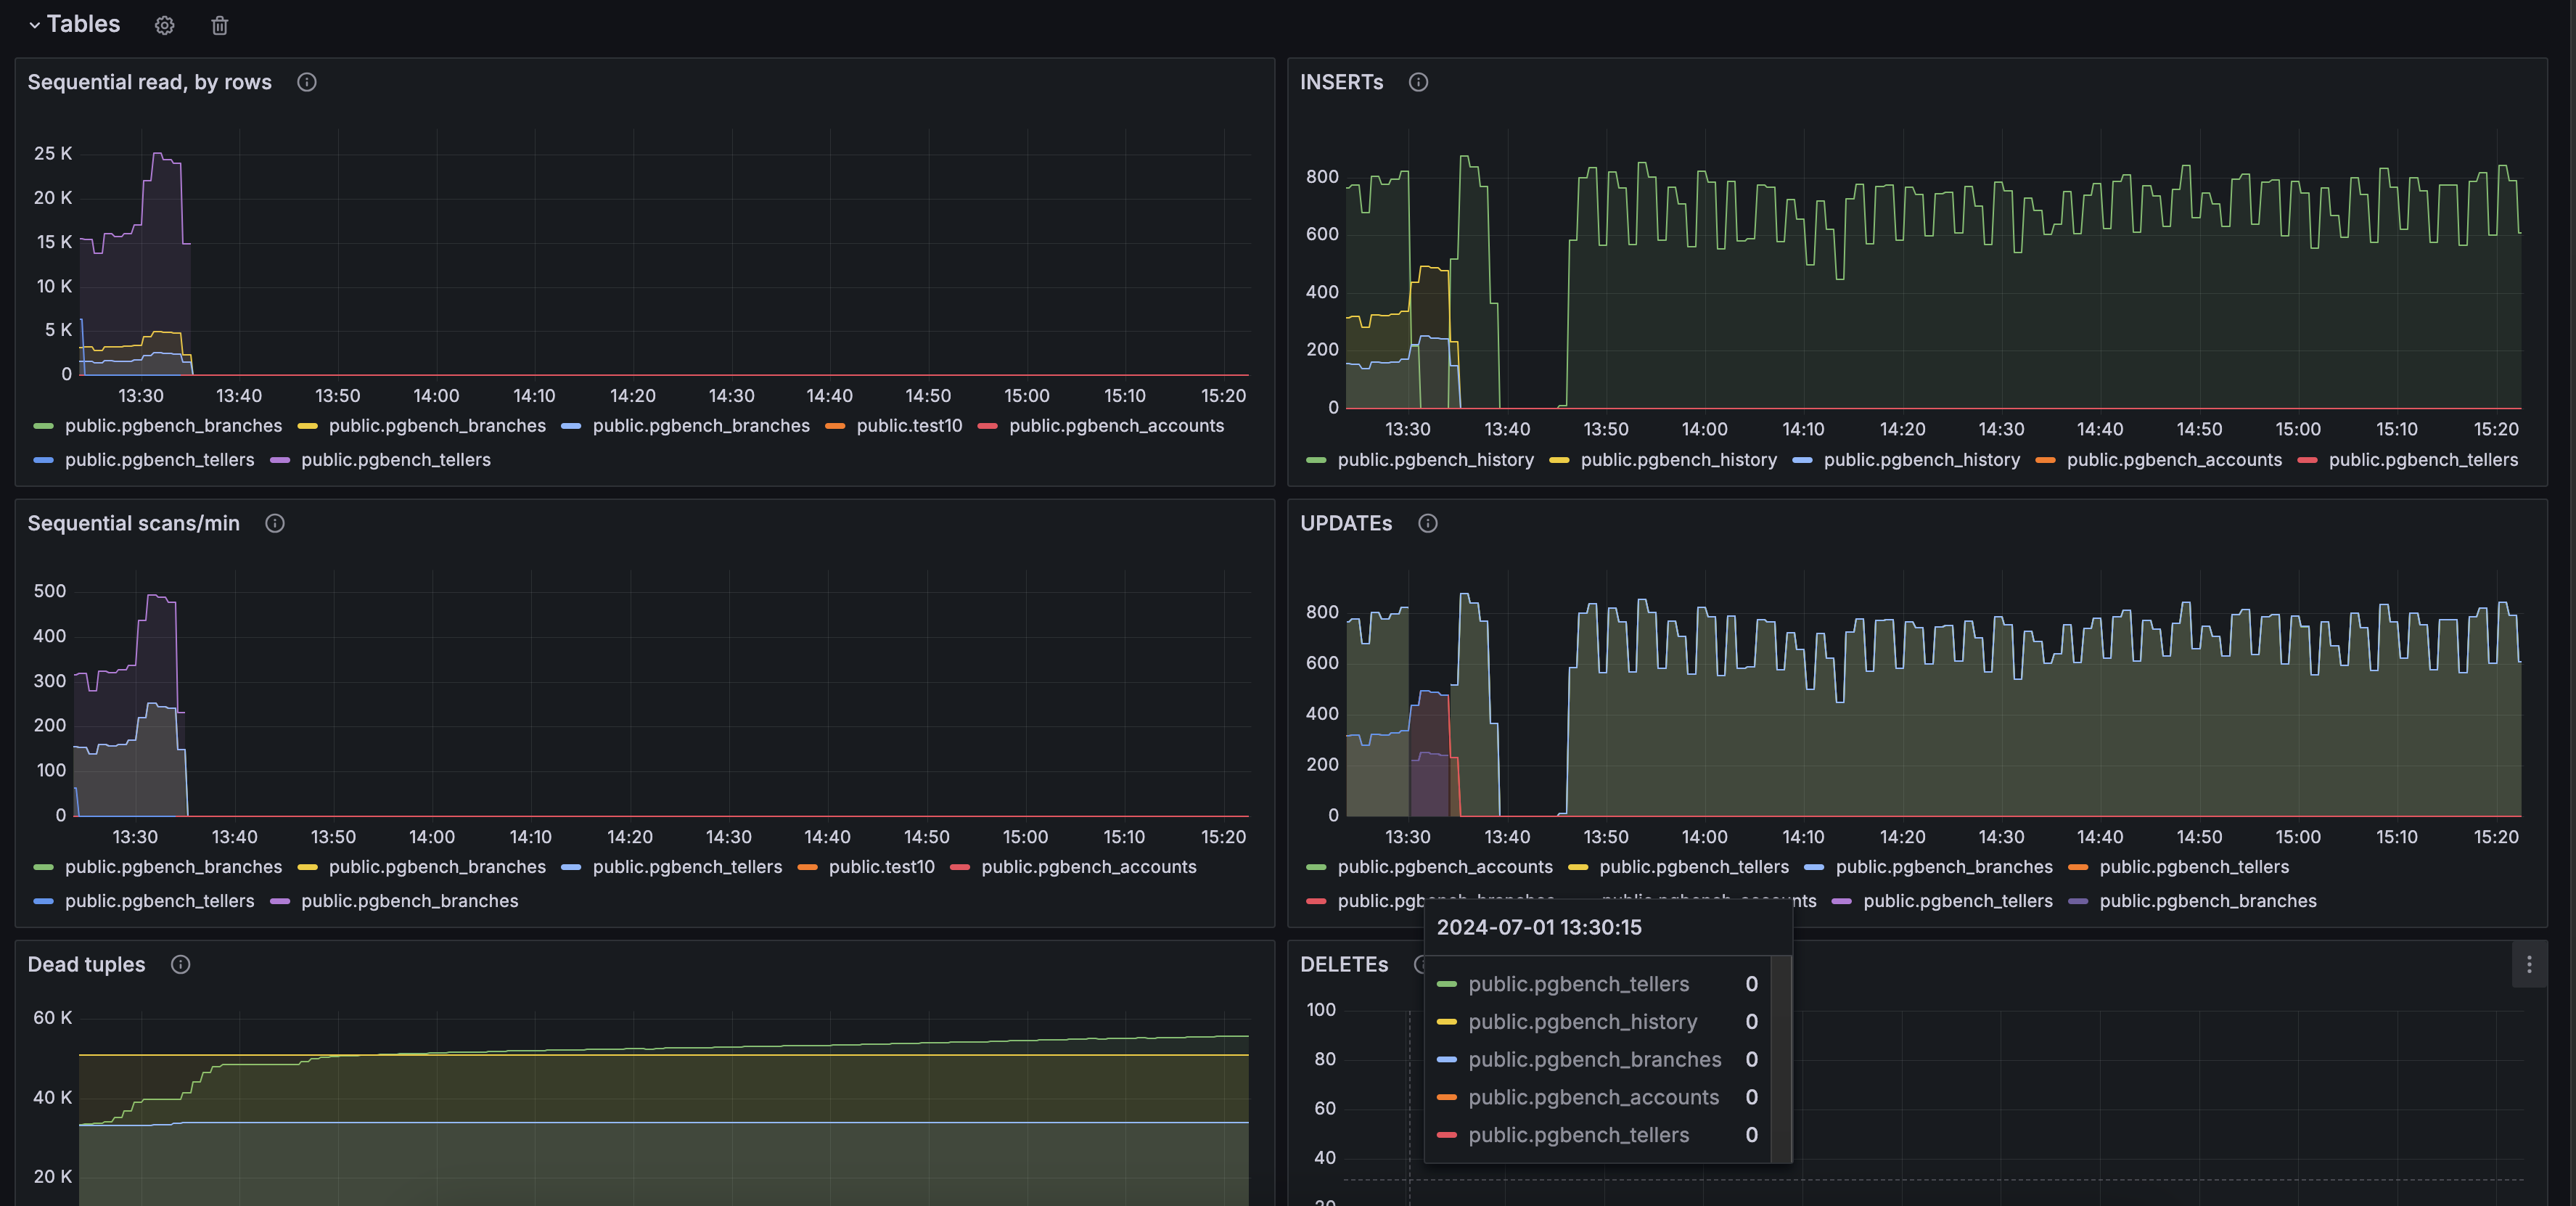
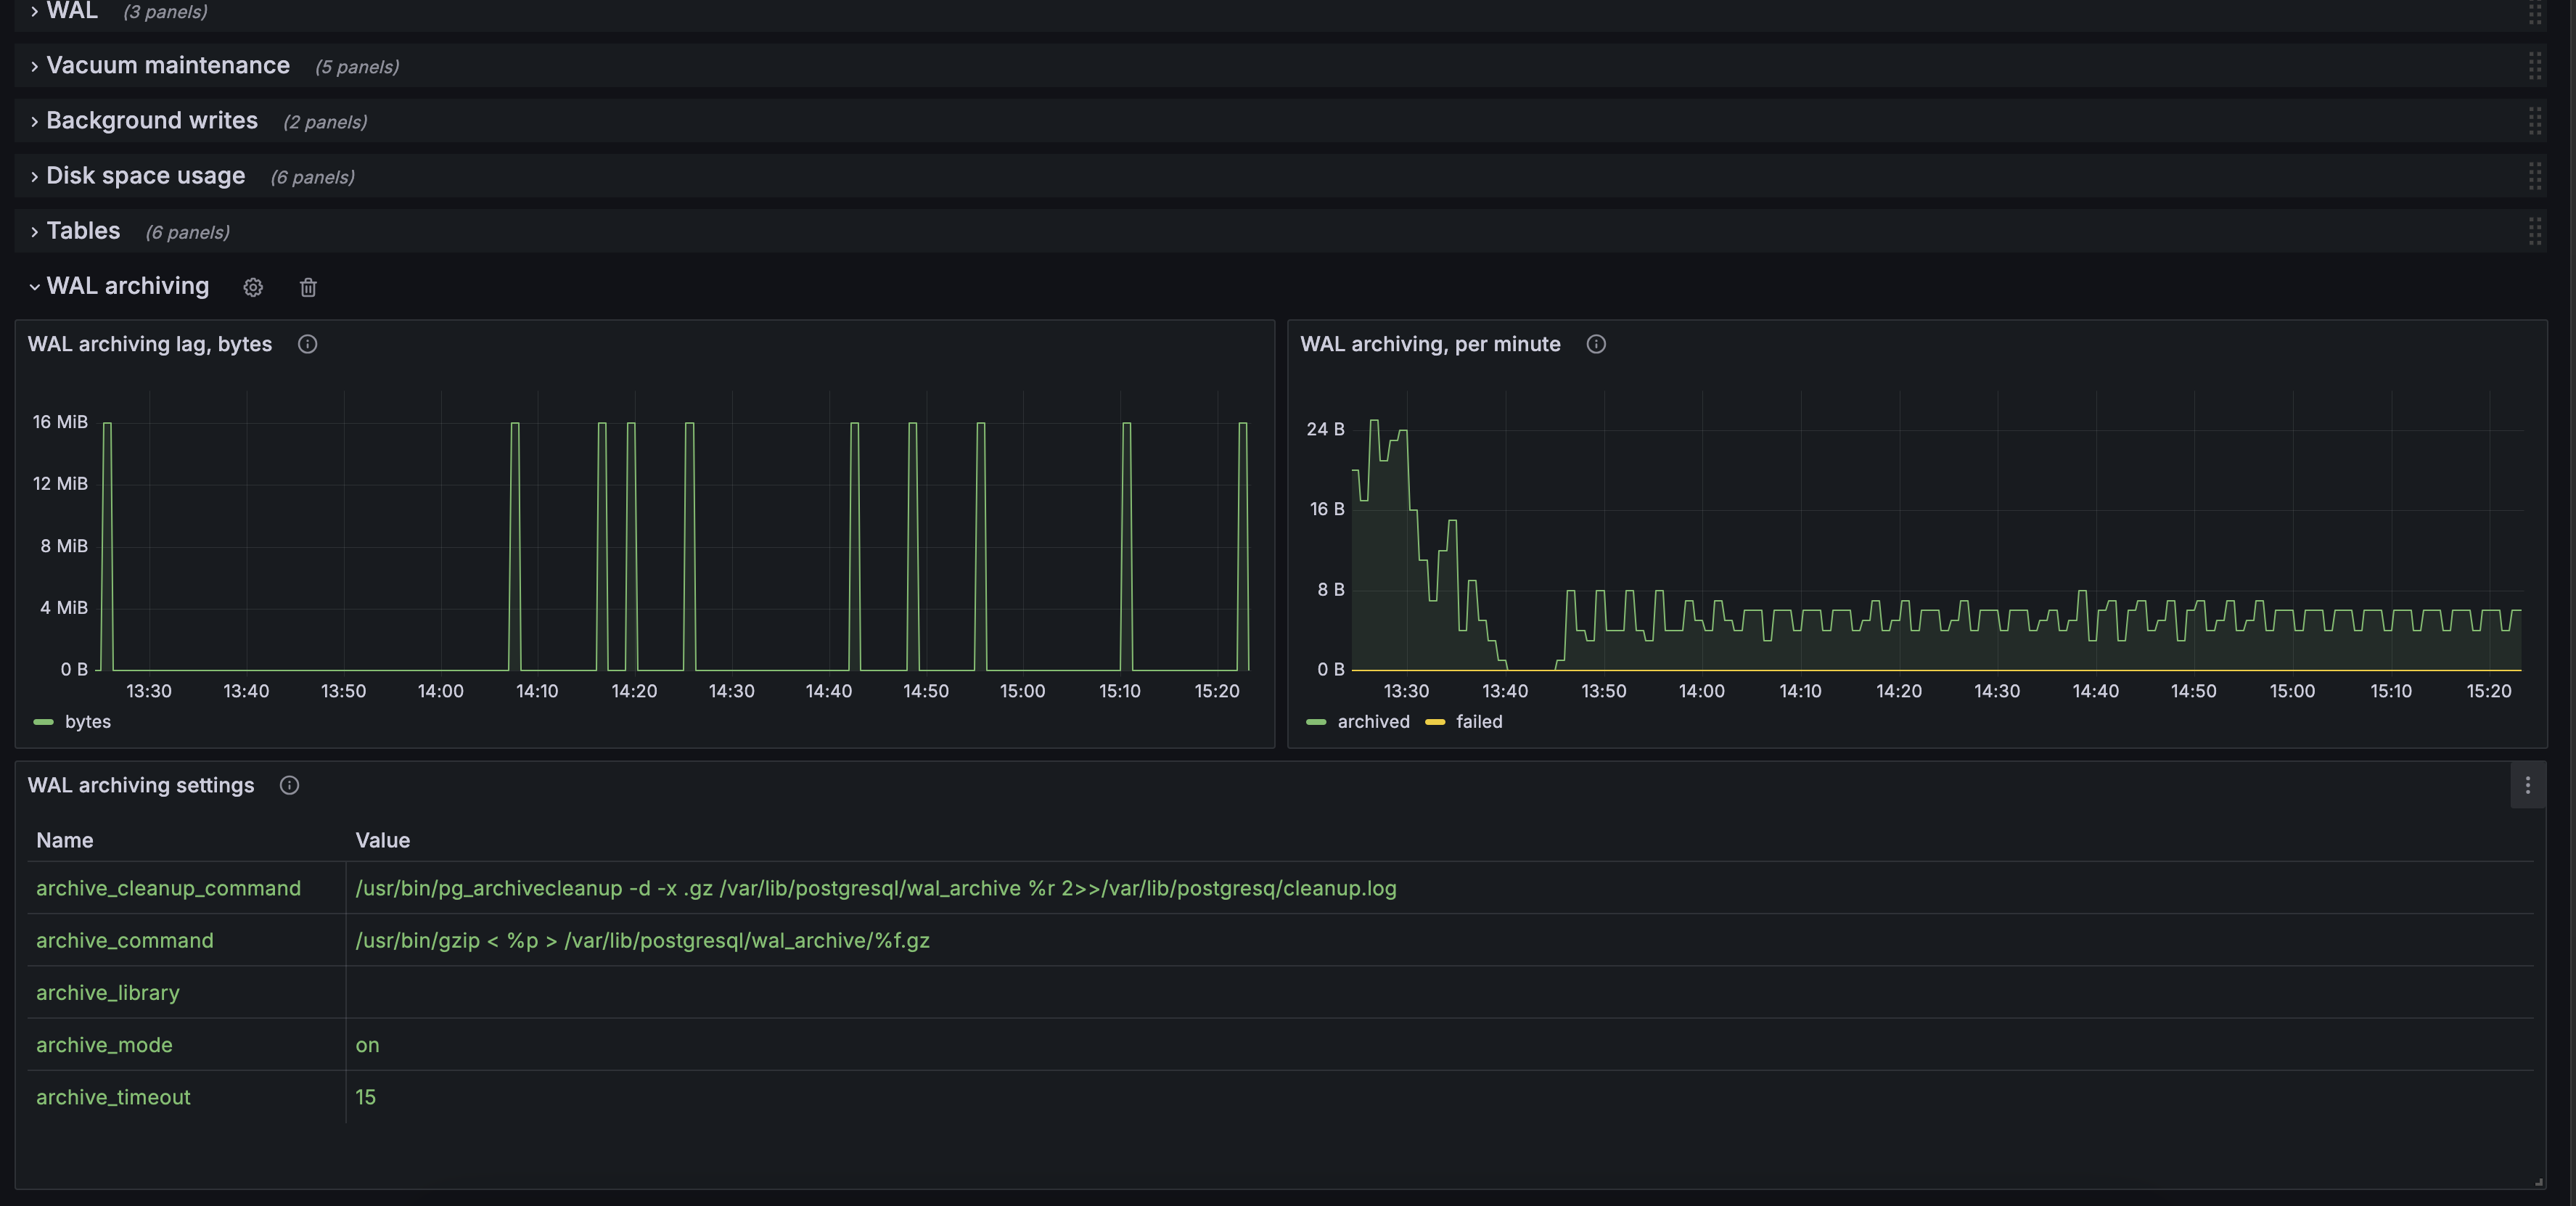
PostgreSQL dashboard for pgSCV metrics (Prometheus version, pgSCV v0.14.0 edition)
Screenshots
Used Metrics 1717
postgres_activity_connections_in_flight
postgres_activity_max_seconds
postgres_activity_vacuums_in_flight
postgres_database_checksum_failures_total
postgres_database_conflicts_total
postgres_database_deadlocks_total
postgres_database_sessions_total
postgres_database_xact_rollbacks_total
postgres_index_scans_total
postgres_log_messages_total
postgres_recovery_info
postgres_replication_slot_wal_retain_bytes
postgres_stat_ssl_conn_number
postgres_stat_subscription_error_count
postgres_statements_calls_total
postgres_statements_time_seconds_all_total
postgres_up
Get Dashboard✕
Download
Copy to Clipboard