pgSCV: PostgreSQL 2,6972,697 5.0 (1 reviews)
6/4/2021
7/11/2021
4
Databases
>=7.5.7
Prometheus
Description
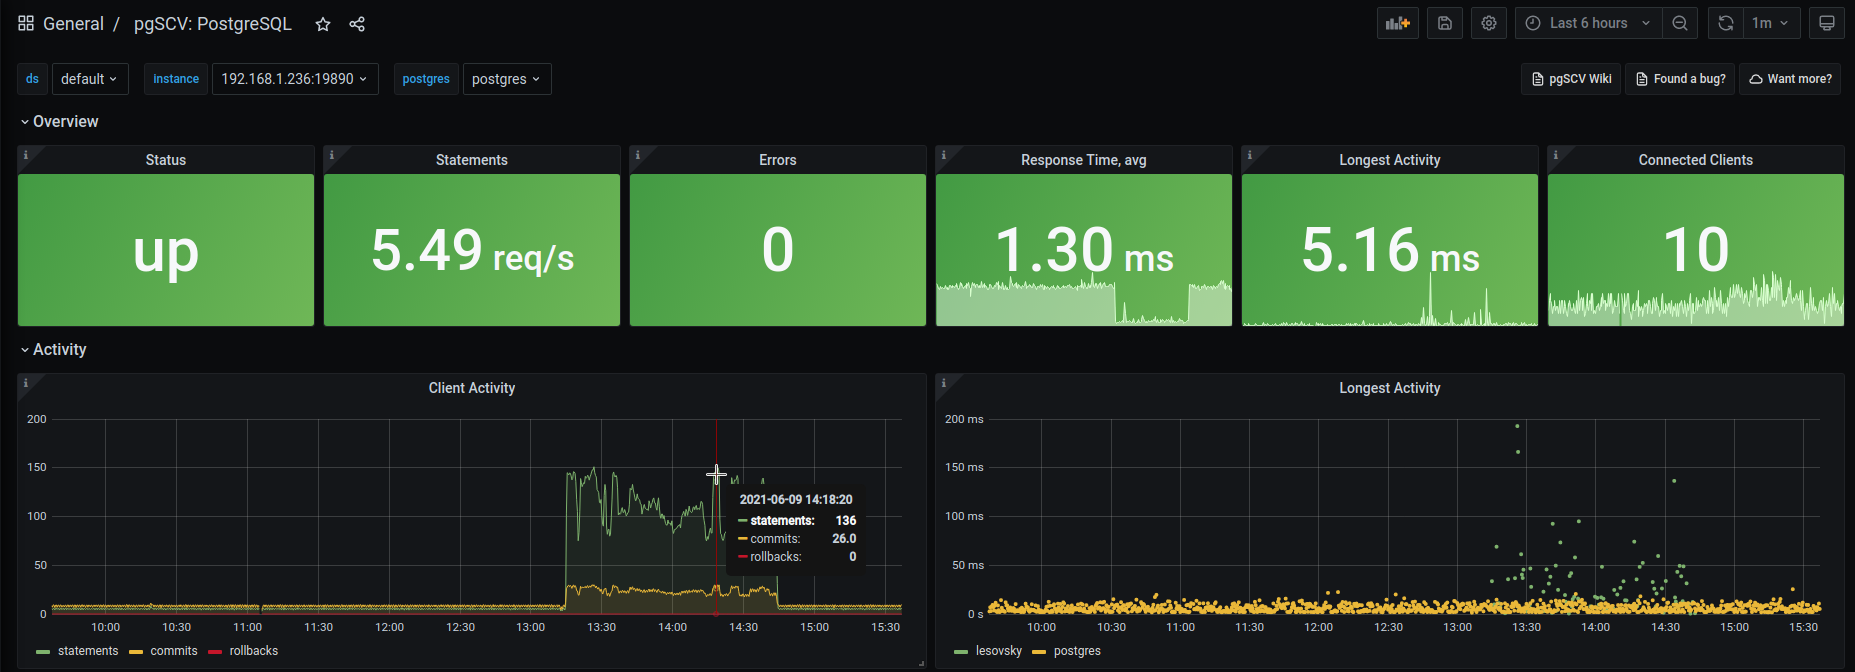
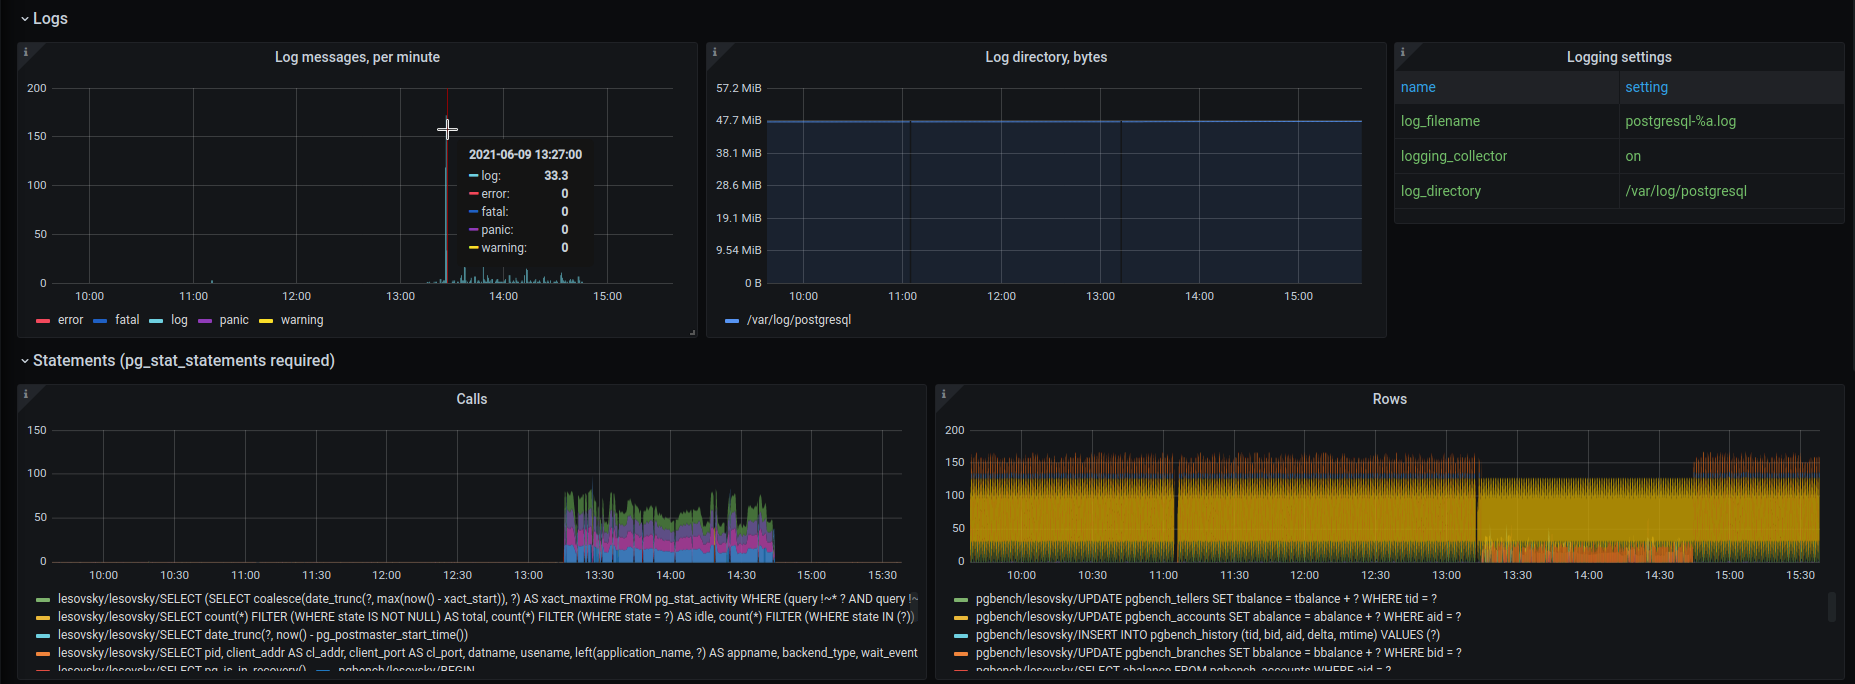
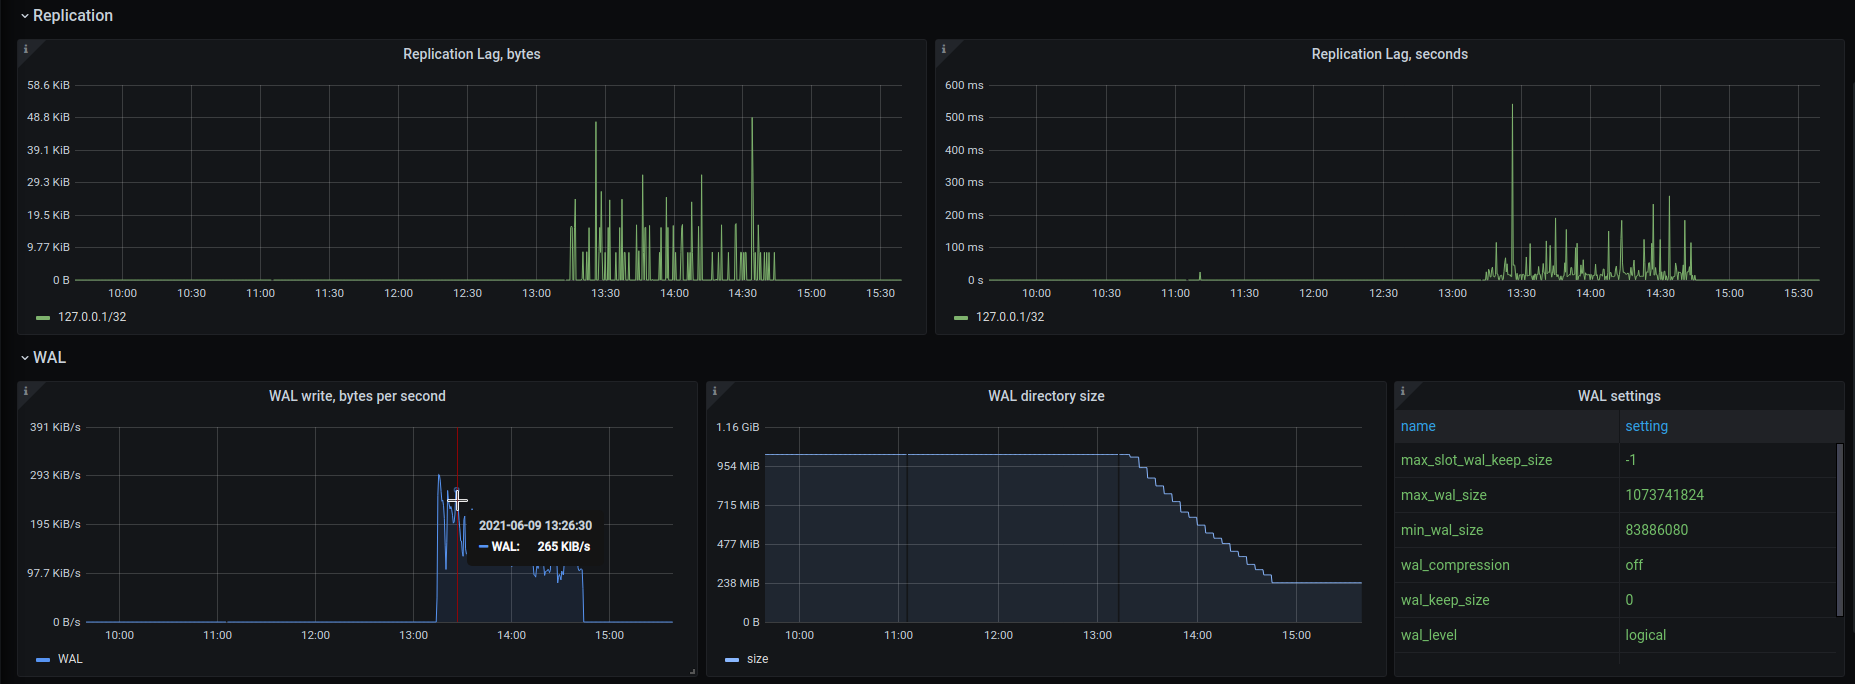
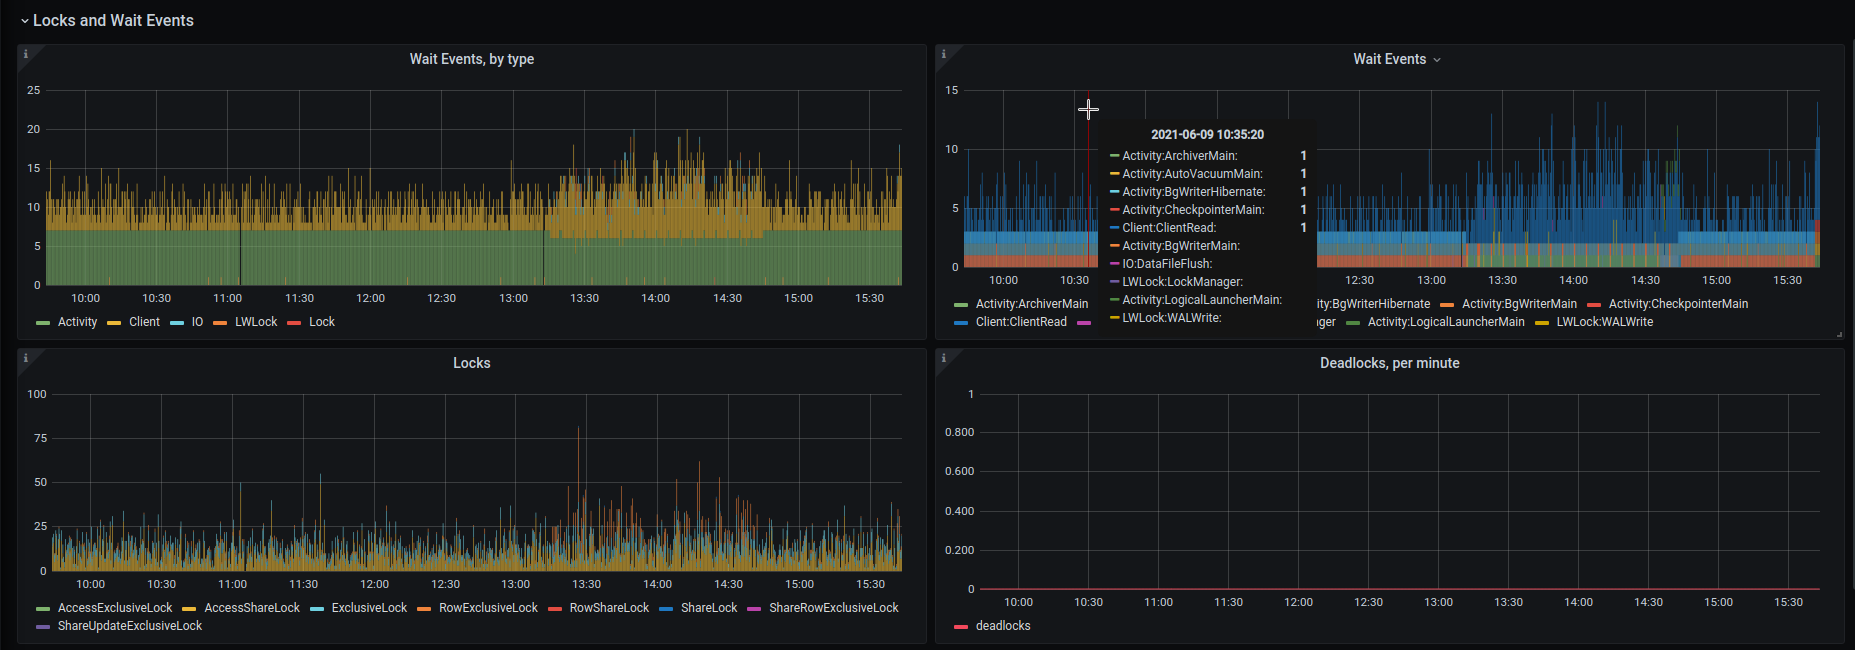
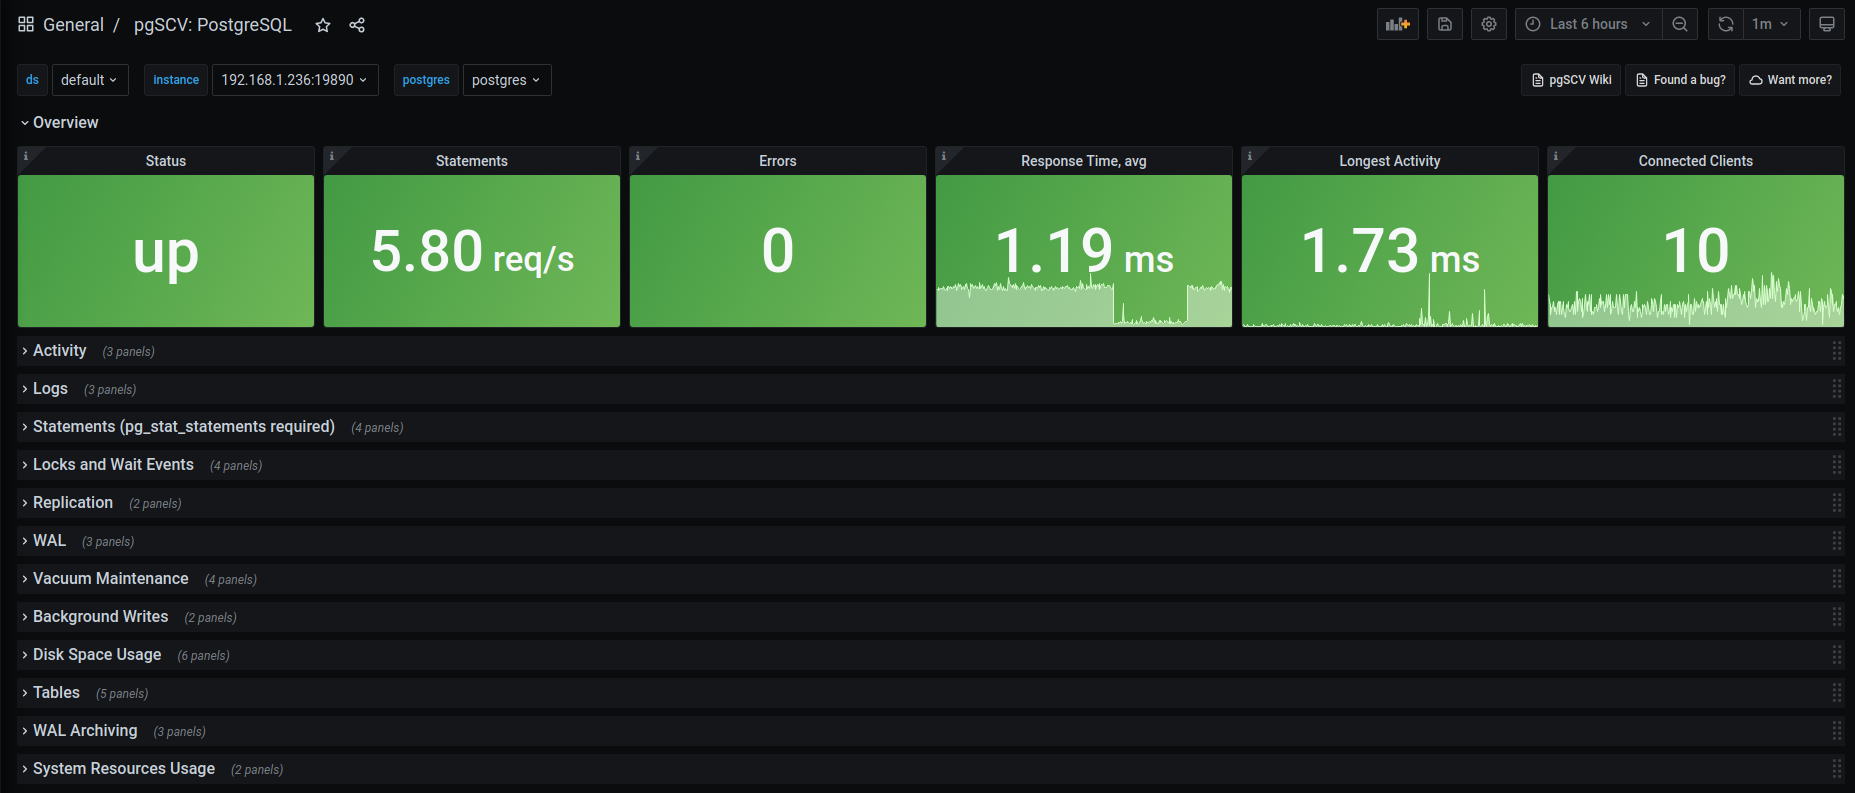
PostgreSQL dashboard for pgSCV metrics (Prometheus version, pgSCV 0.7.0 edition)
Screenshots
Used Metrics 66
postgres_activity_connections_in_flight
postgres_activity_max_seconds
postgres_log_messages_total
postgres_statements_calls_total
postgres_statements_time_seconds_all_total
postgres_up
Get Dashboard✕
Download
Copy to Clipboard