Prom
hub
Alerts
Dashboards
Exporters
Metrics
Alerts
Dashboards
Exporters
Metrics
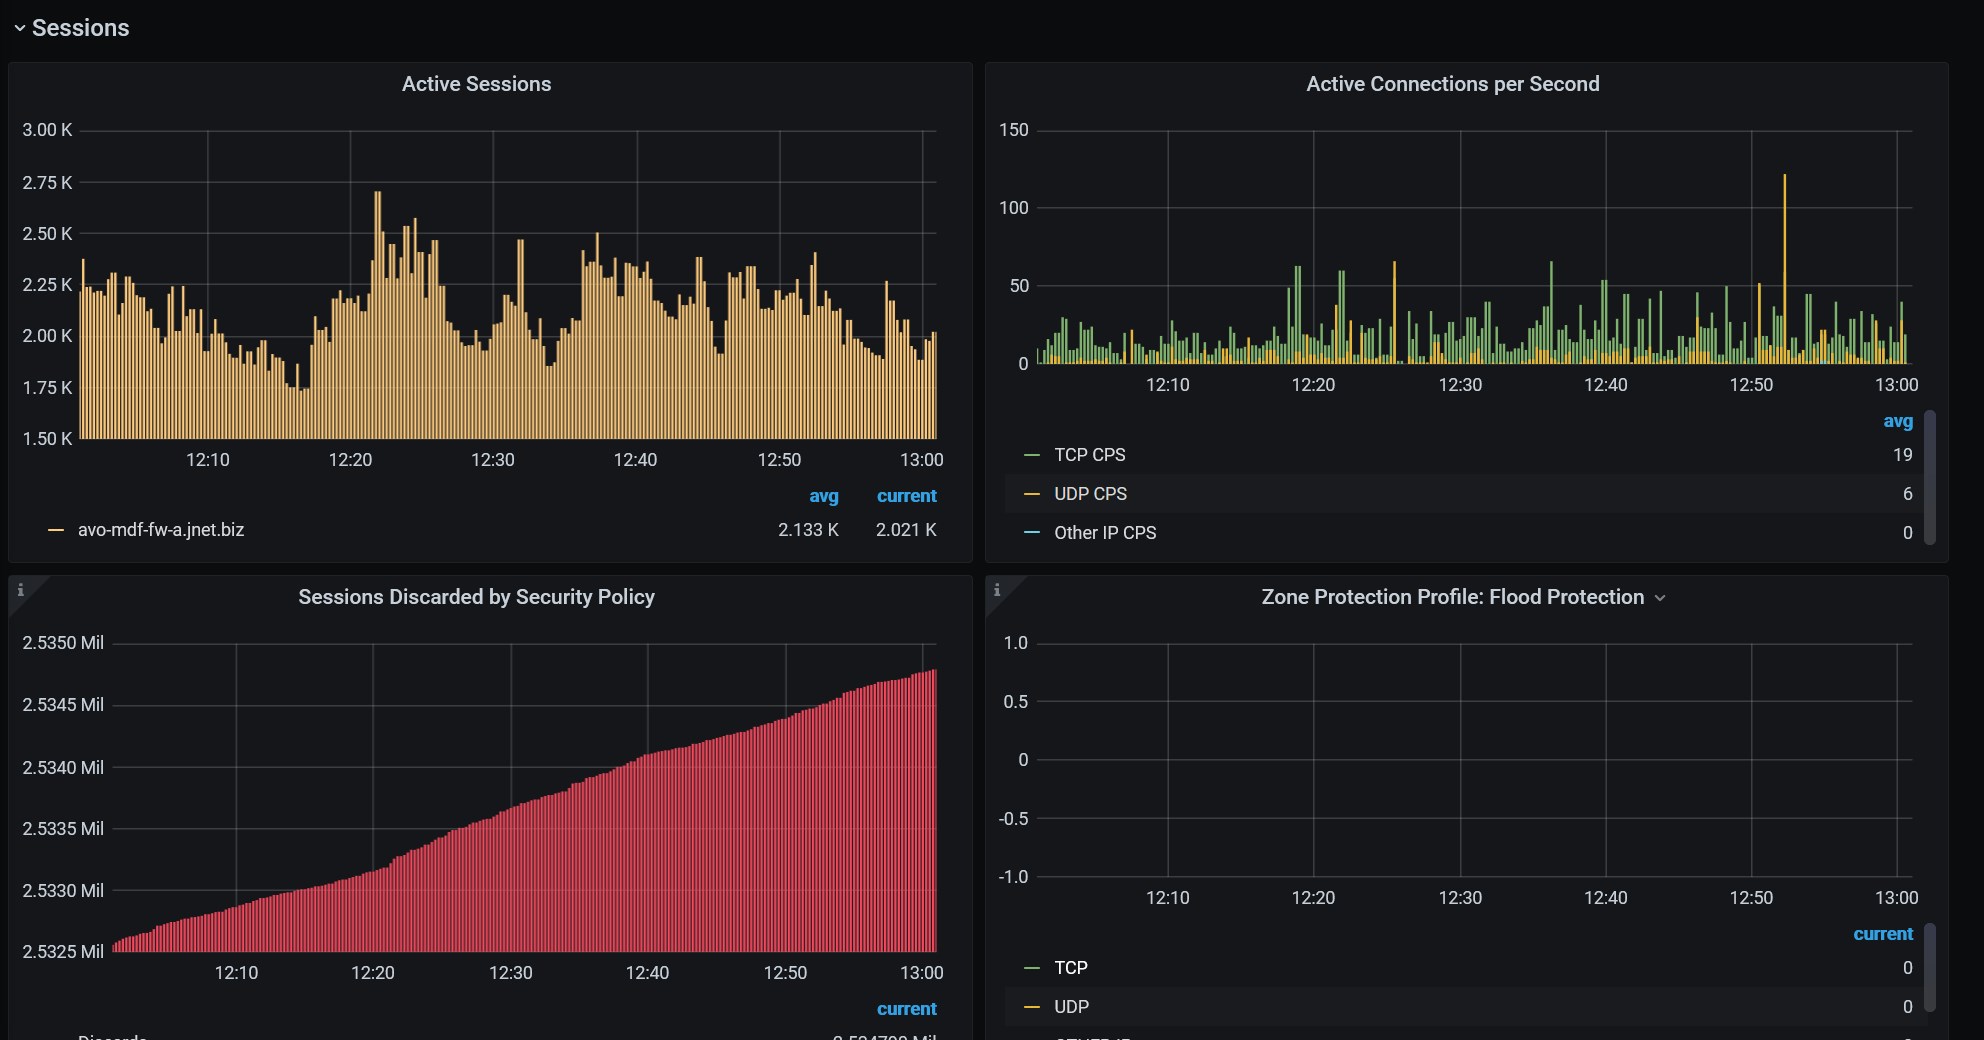
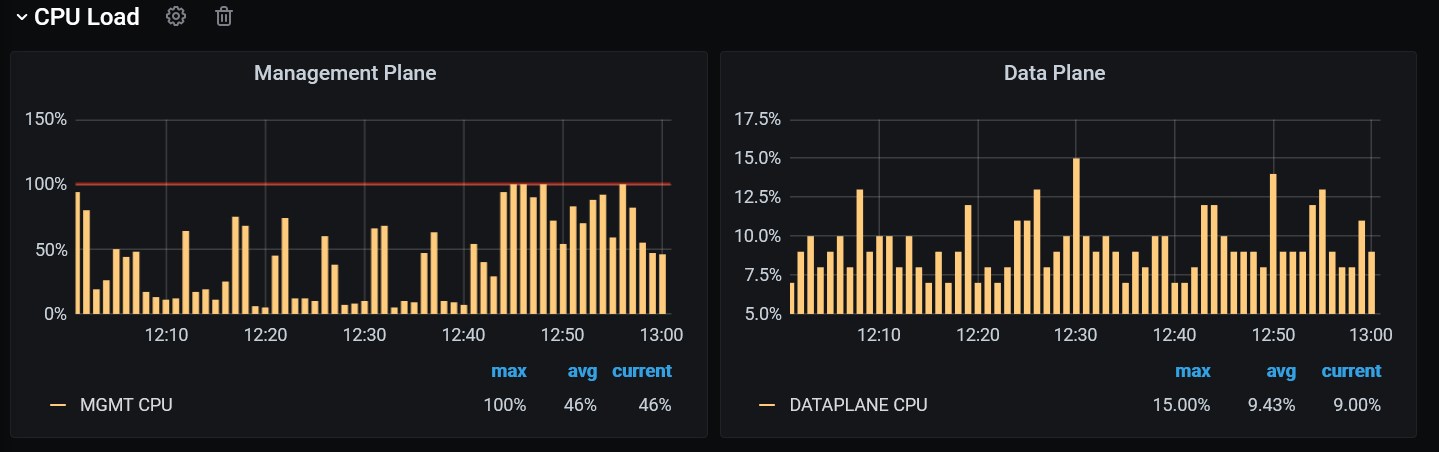
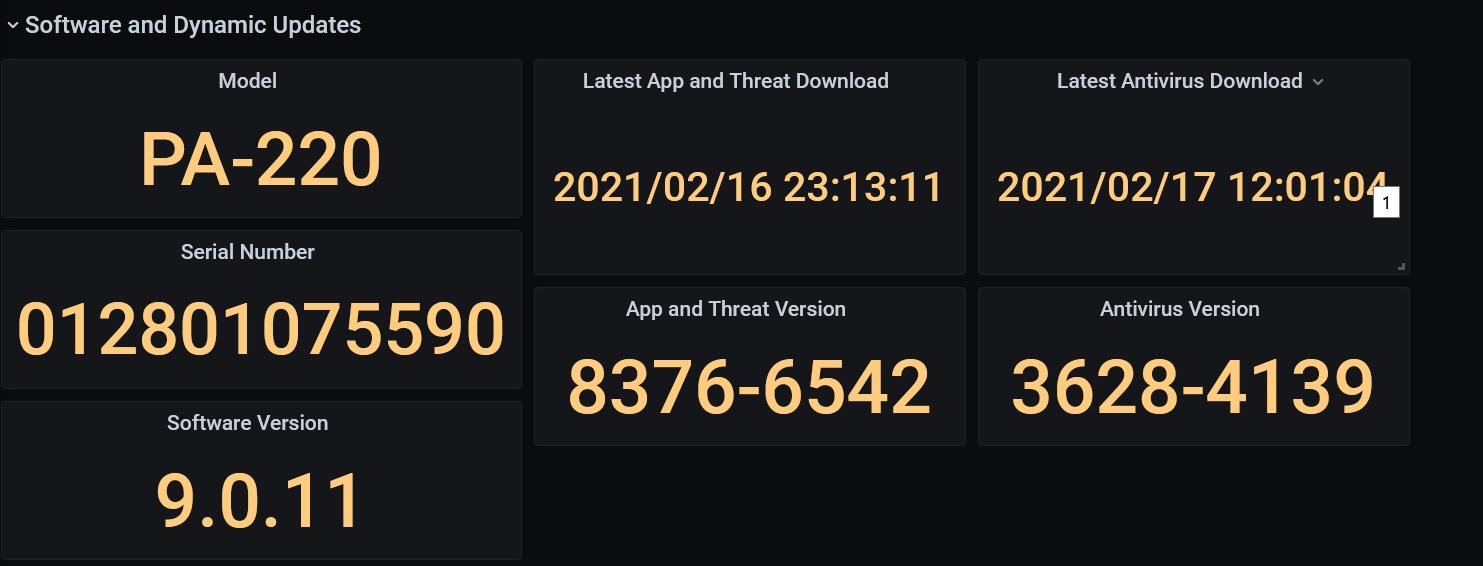
Palo Alto Firewalls
3
0
,
9
0
9
30,909
Show Preview
Get Dashboard
Download
Copy to Clipboard
Created
2/17/2021
Updated
2/17/2021
Revision
1
Grafana Version
>=7.1.0
Datasources
Prometheus
Description
PaloAlto PANOS
Screenshots
1
2
3
Source
Grafana.com
Get Dashboard
✕
Download
Copy to Clipboard
✕
Dashboard Preview - Palo Alto Firewalls
Most Grafana dashboards are not optimized for small screens. For the best experience, view this preview on a larger screen.
grafana.shipit.dev/palo-alto-firewalls
close