OracleDB Monitoring - performance and table space stats 11,08311,083
12/10/2020
12/14/2020
2
Databases
>=7.3.5
Prometheus
Description
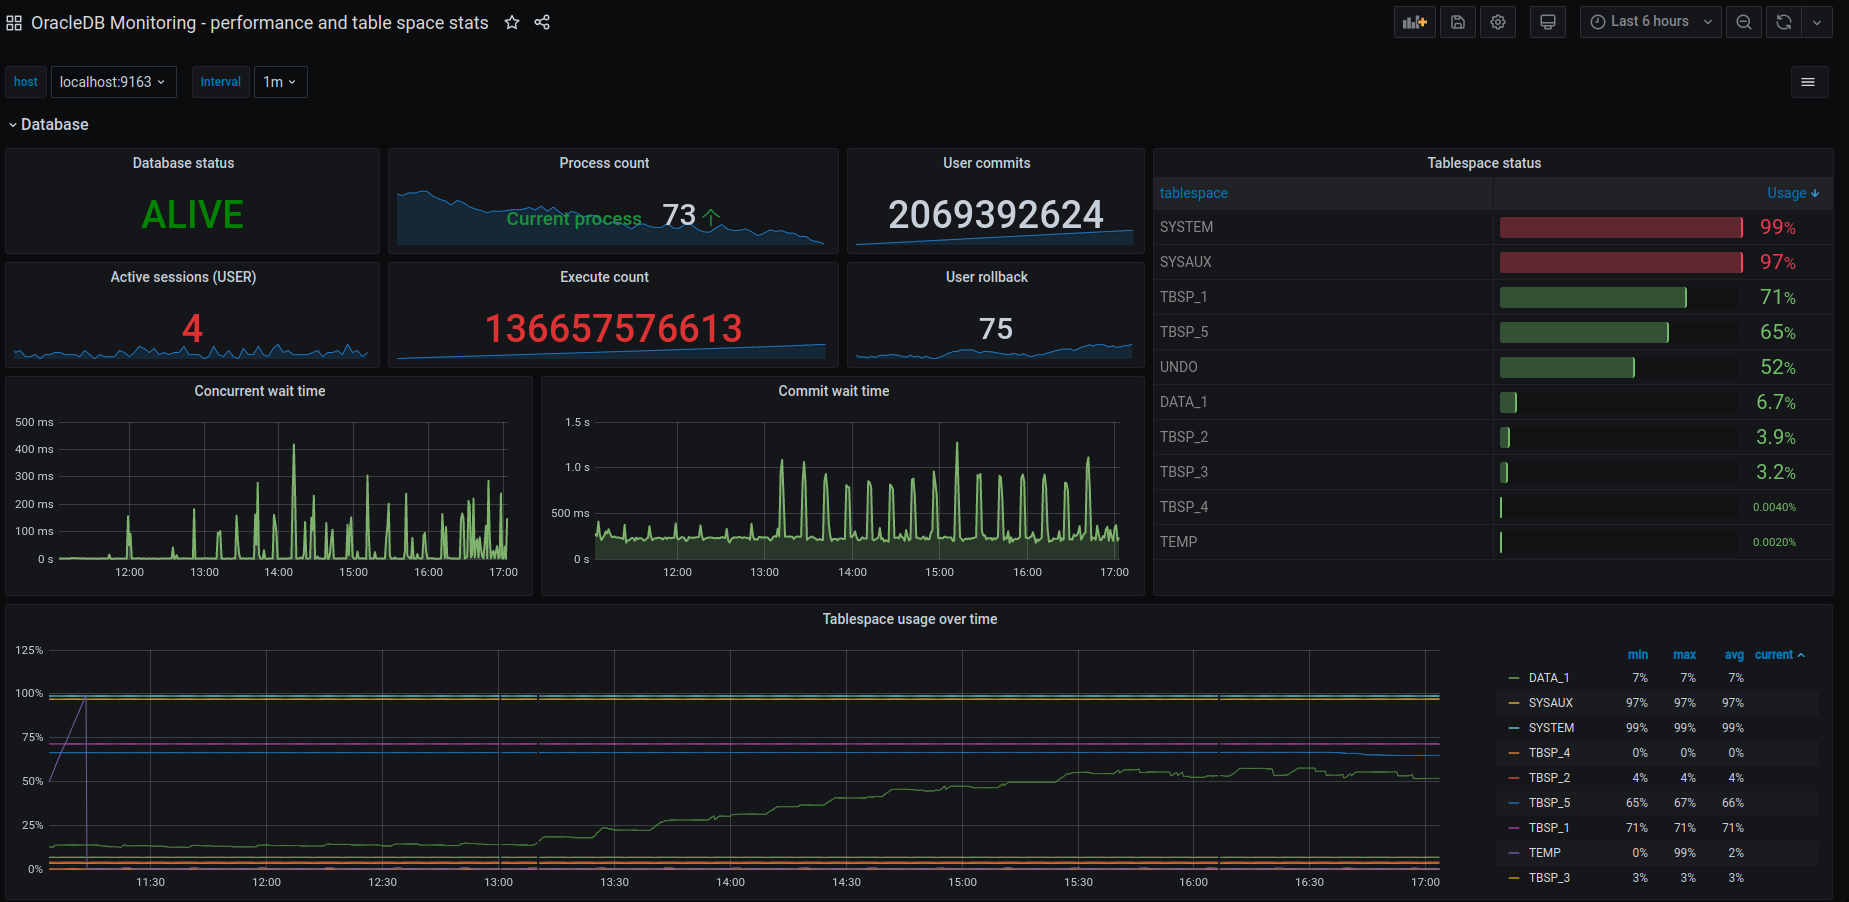
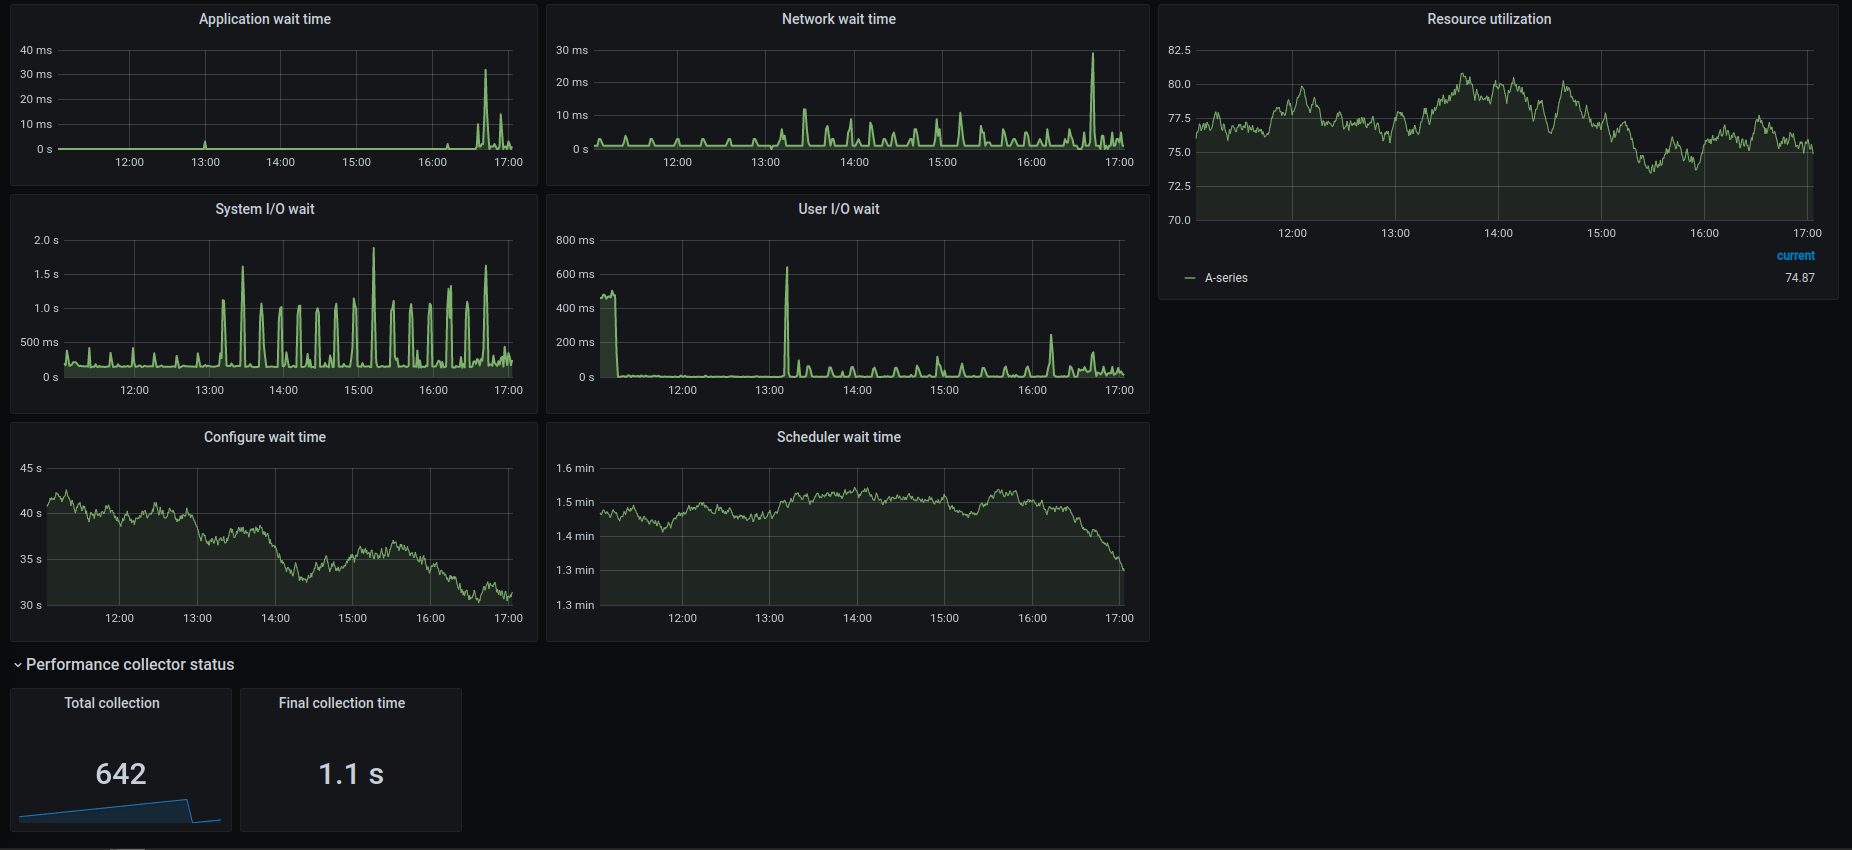
Use oracledb exporter for oracle database monitoring. Compared with other dashboards, tablespace monitoring is added, which can be expanded to set tablespace alarms
Screenshots
Used Metrics 1919
oracledb_activity_execute_count
oracledb_activity_user_commits
oracledb_activity_user_rollbacks
oracledb_exporter_last_scrape_duration_seconds
oracledb_exporter_scrapes_total
oracledb_process_count
oracledb_resource_current_utilization
oracledb_sessions_value
oracledb_tablespace_bytes
oracledb_tablespace_free
oracledb_up
oracledb_wait_time_application
oracledb_wait_time_commit
oracledb_wait_time_concurrency
oracledb_wait_time_configuration
oracledb_wait_time_network
oracledb_wait_time_scheduler
oracledb_wait_time_system_io
oracledb_wait_time_user_io
Get Dashboard✕
Download
Copy to Clipboard