OPNSense Exporter 3,9953,995
5/22/2024
5/22/2024
1
Host Metrics
>=11.1.0-70903
Prometheus
Description
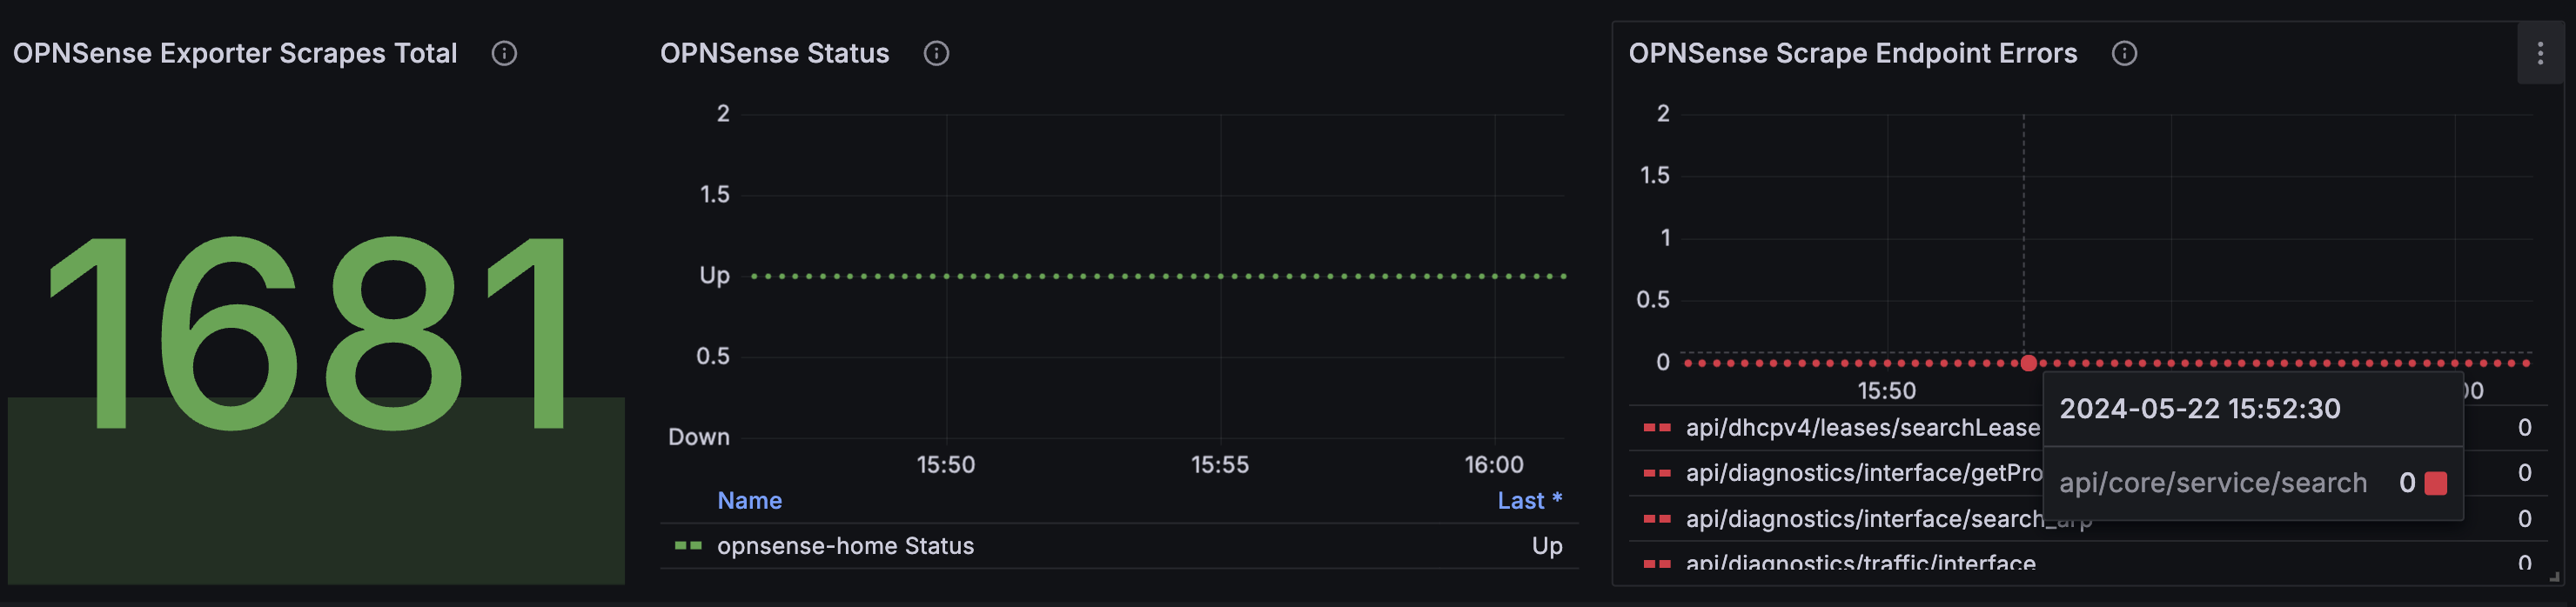
Dashboard for the OPNsense Prometheus Exporter
https://github.com/AthennaMind/opnsense-exporter
From the AthennaMind Team
Screenshots
Used Metrics 1616
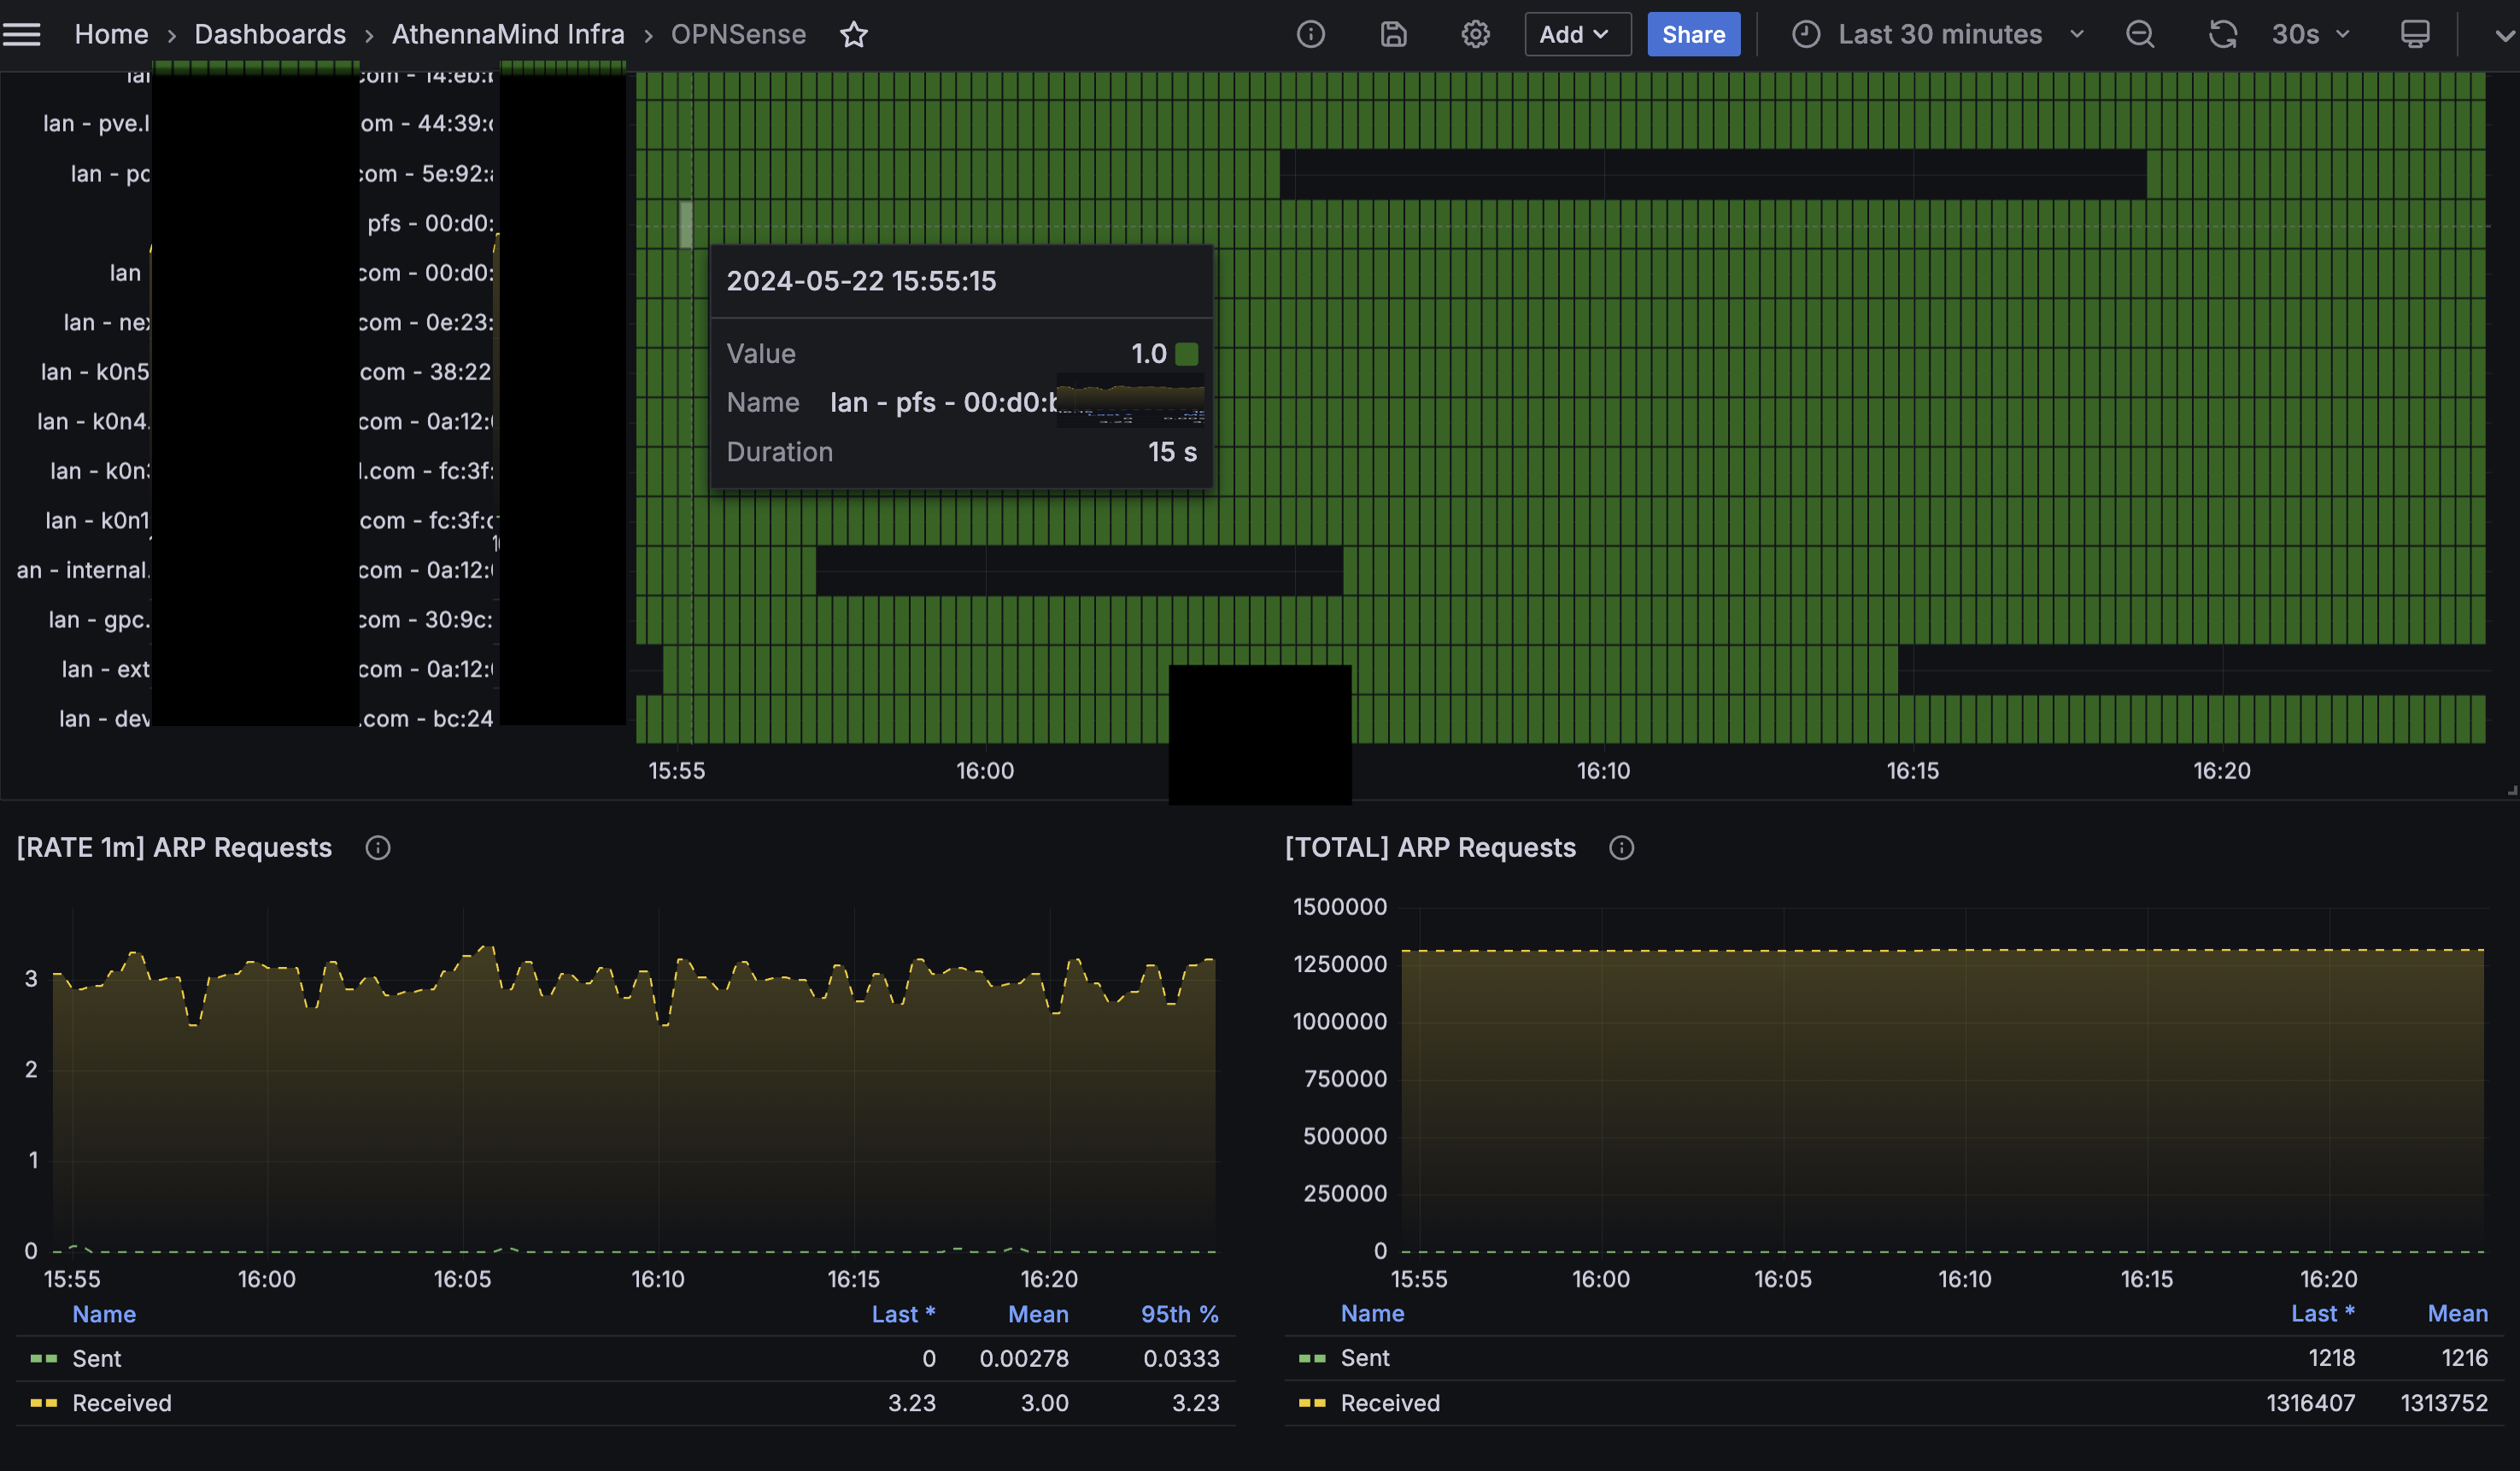
opnsense_arp_table_entries
opnsense_exporter_endpoint_errors_total
opnsense_exporter_scrapes_total
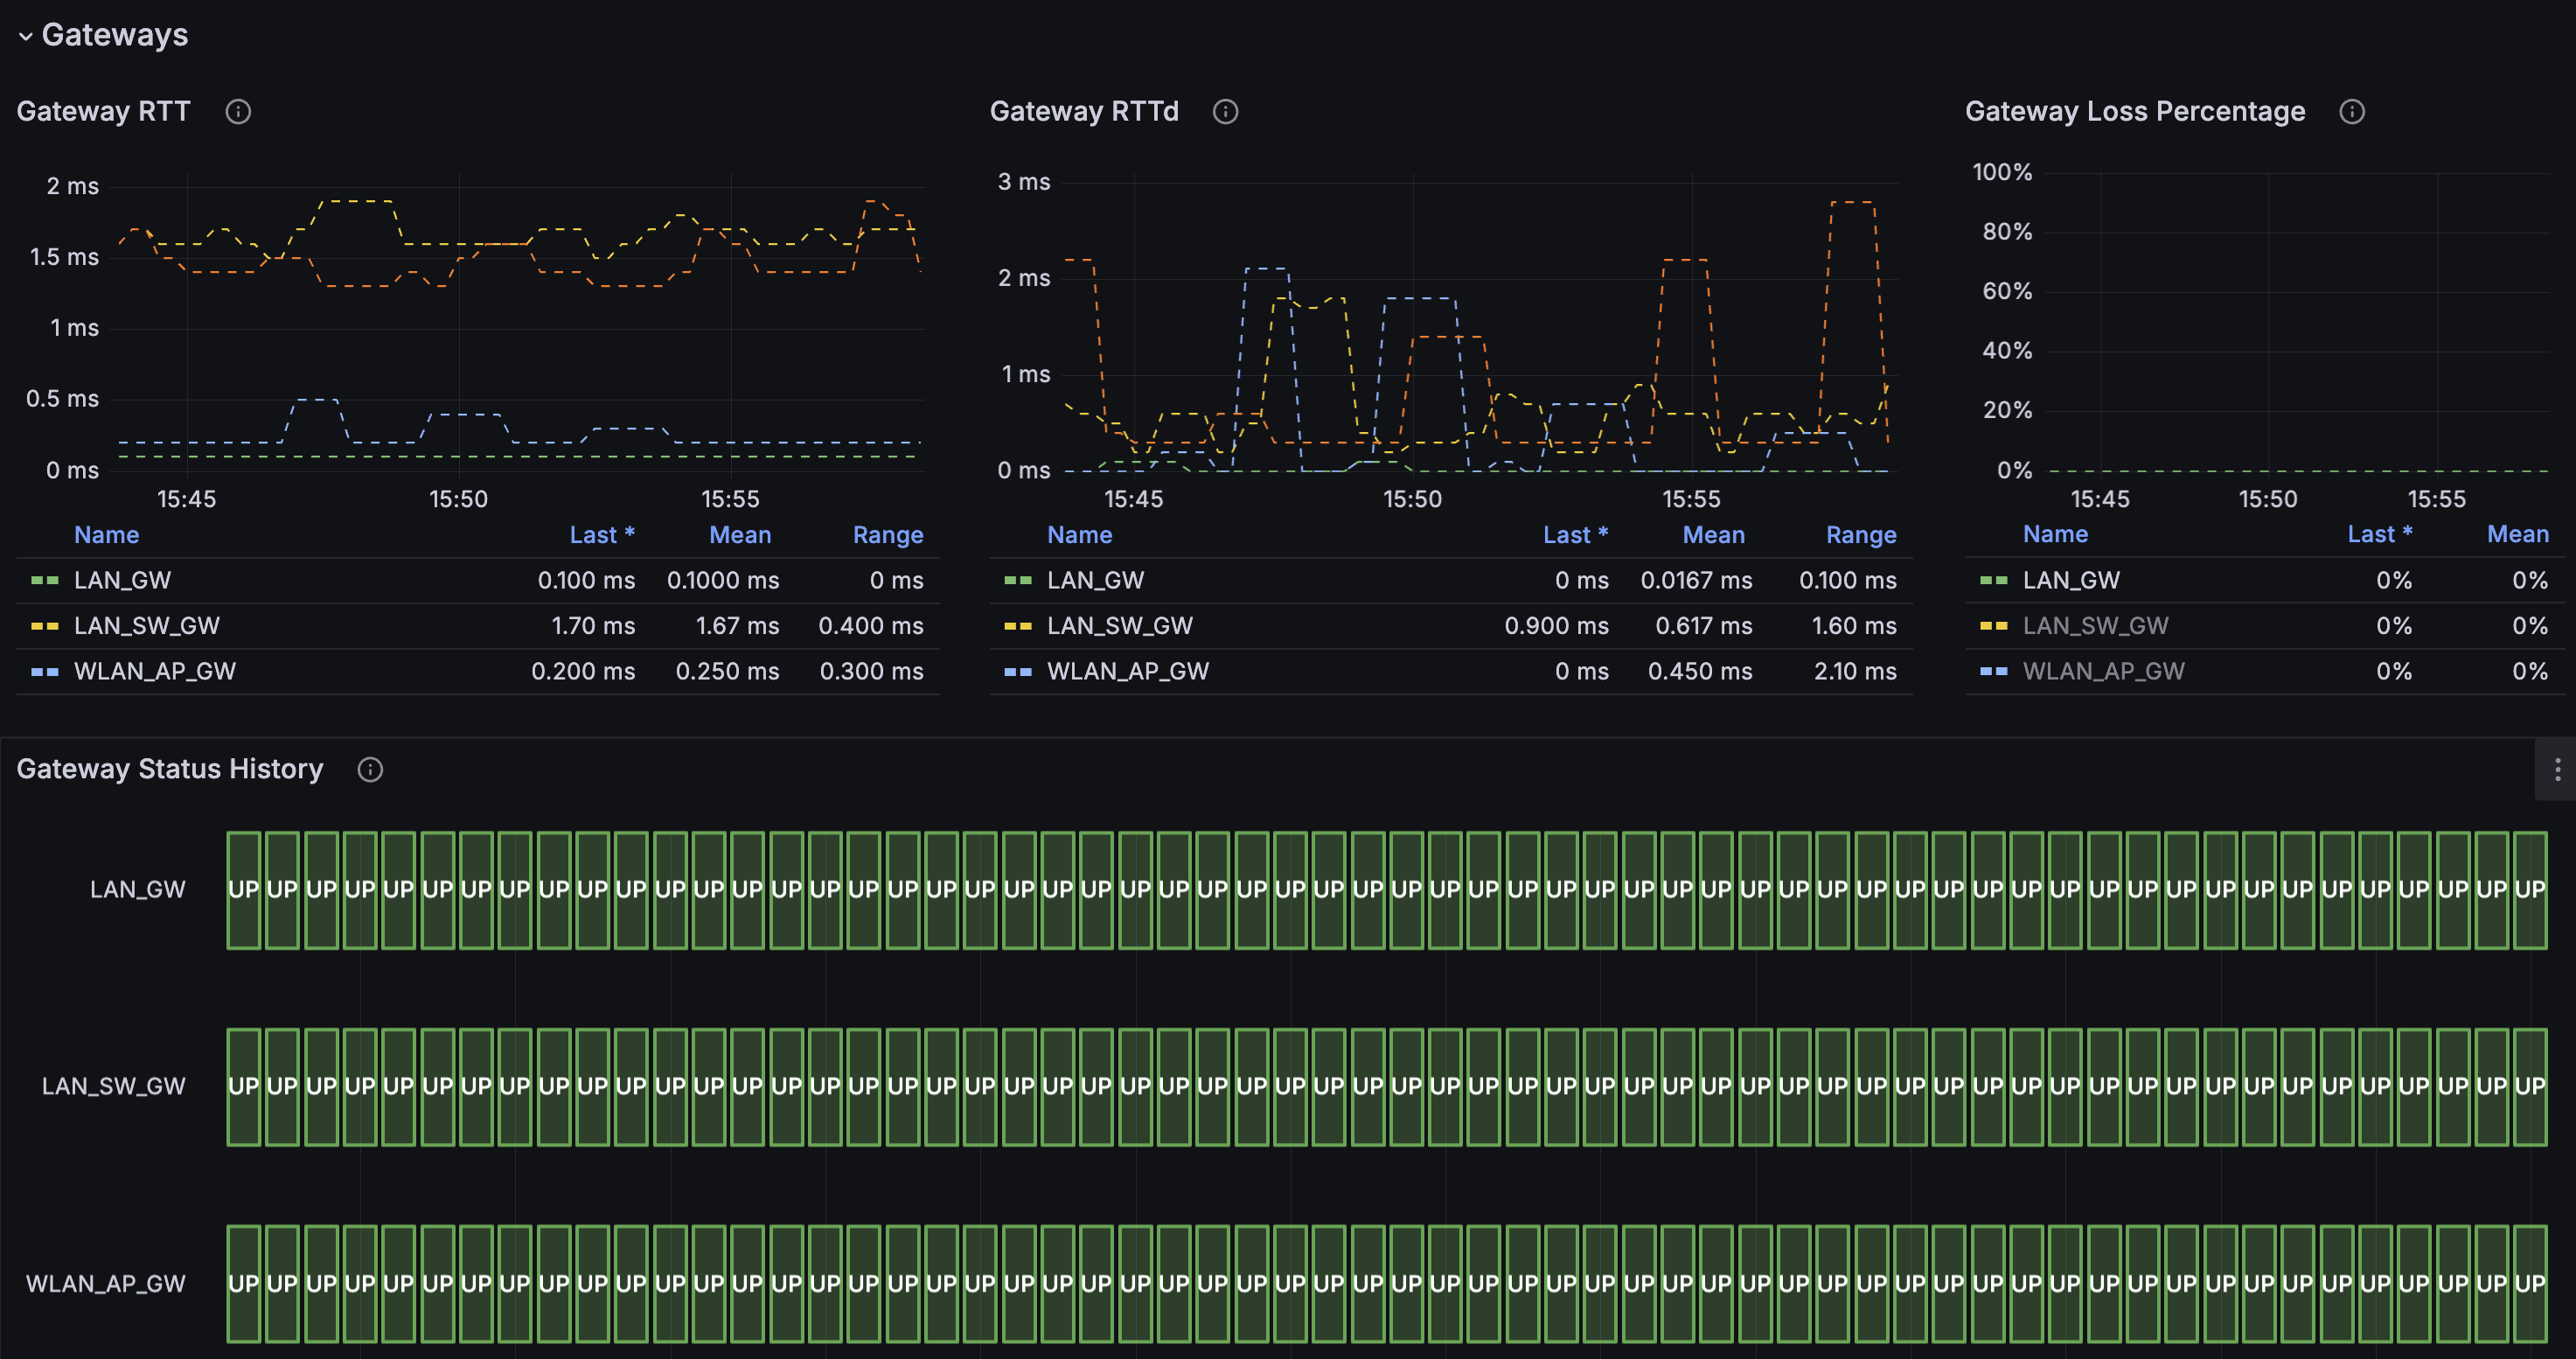
opnsense_gateways_loss_percentage
opnsense_gateways_rtt_milliseconds
opnsense_gateways_rttd_milliseconds
opnsense_gateways_status
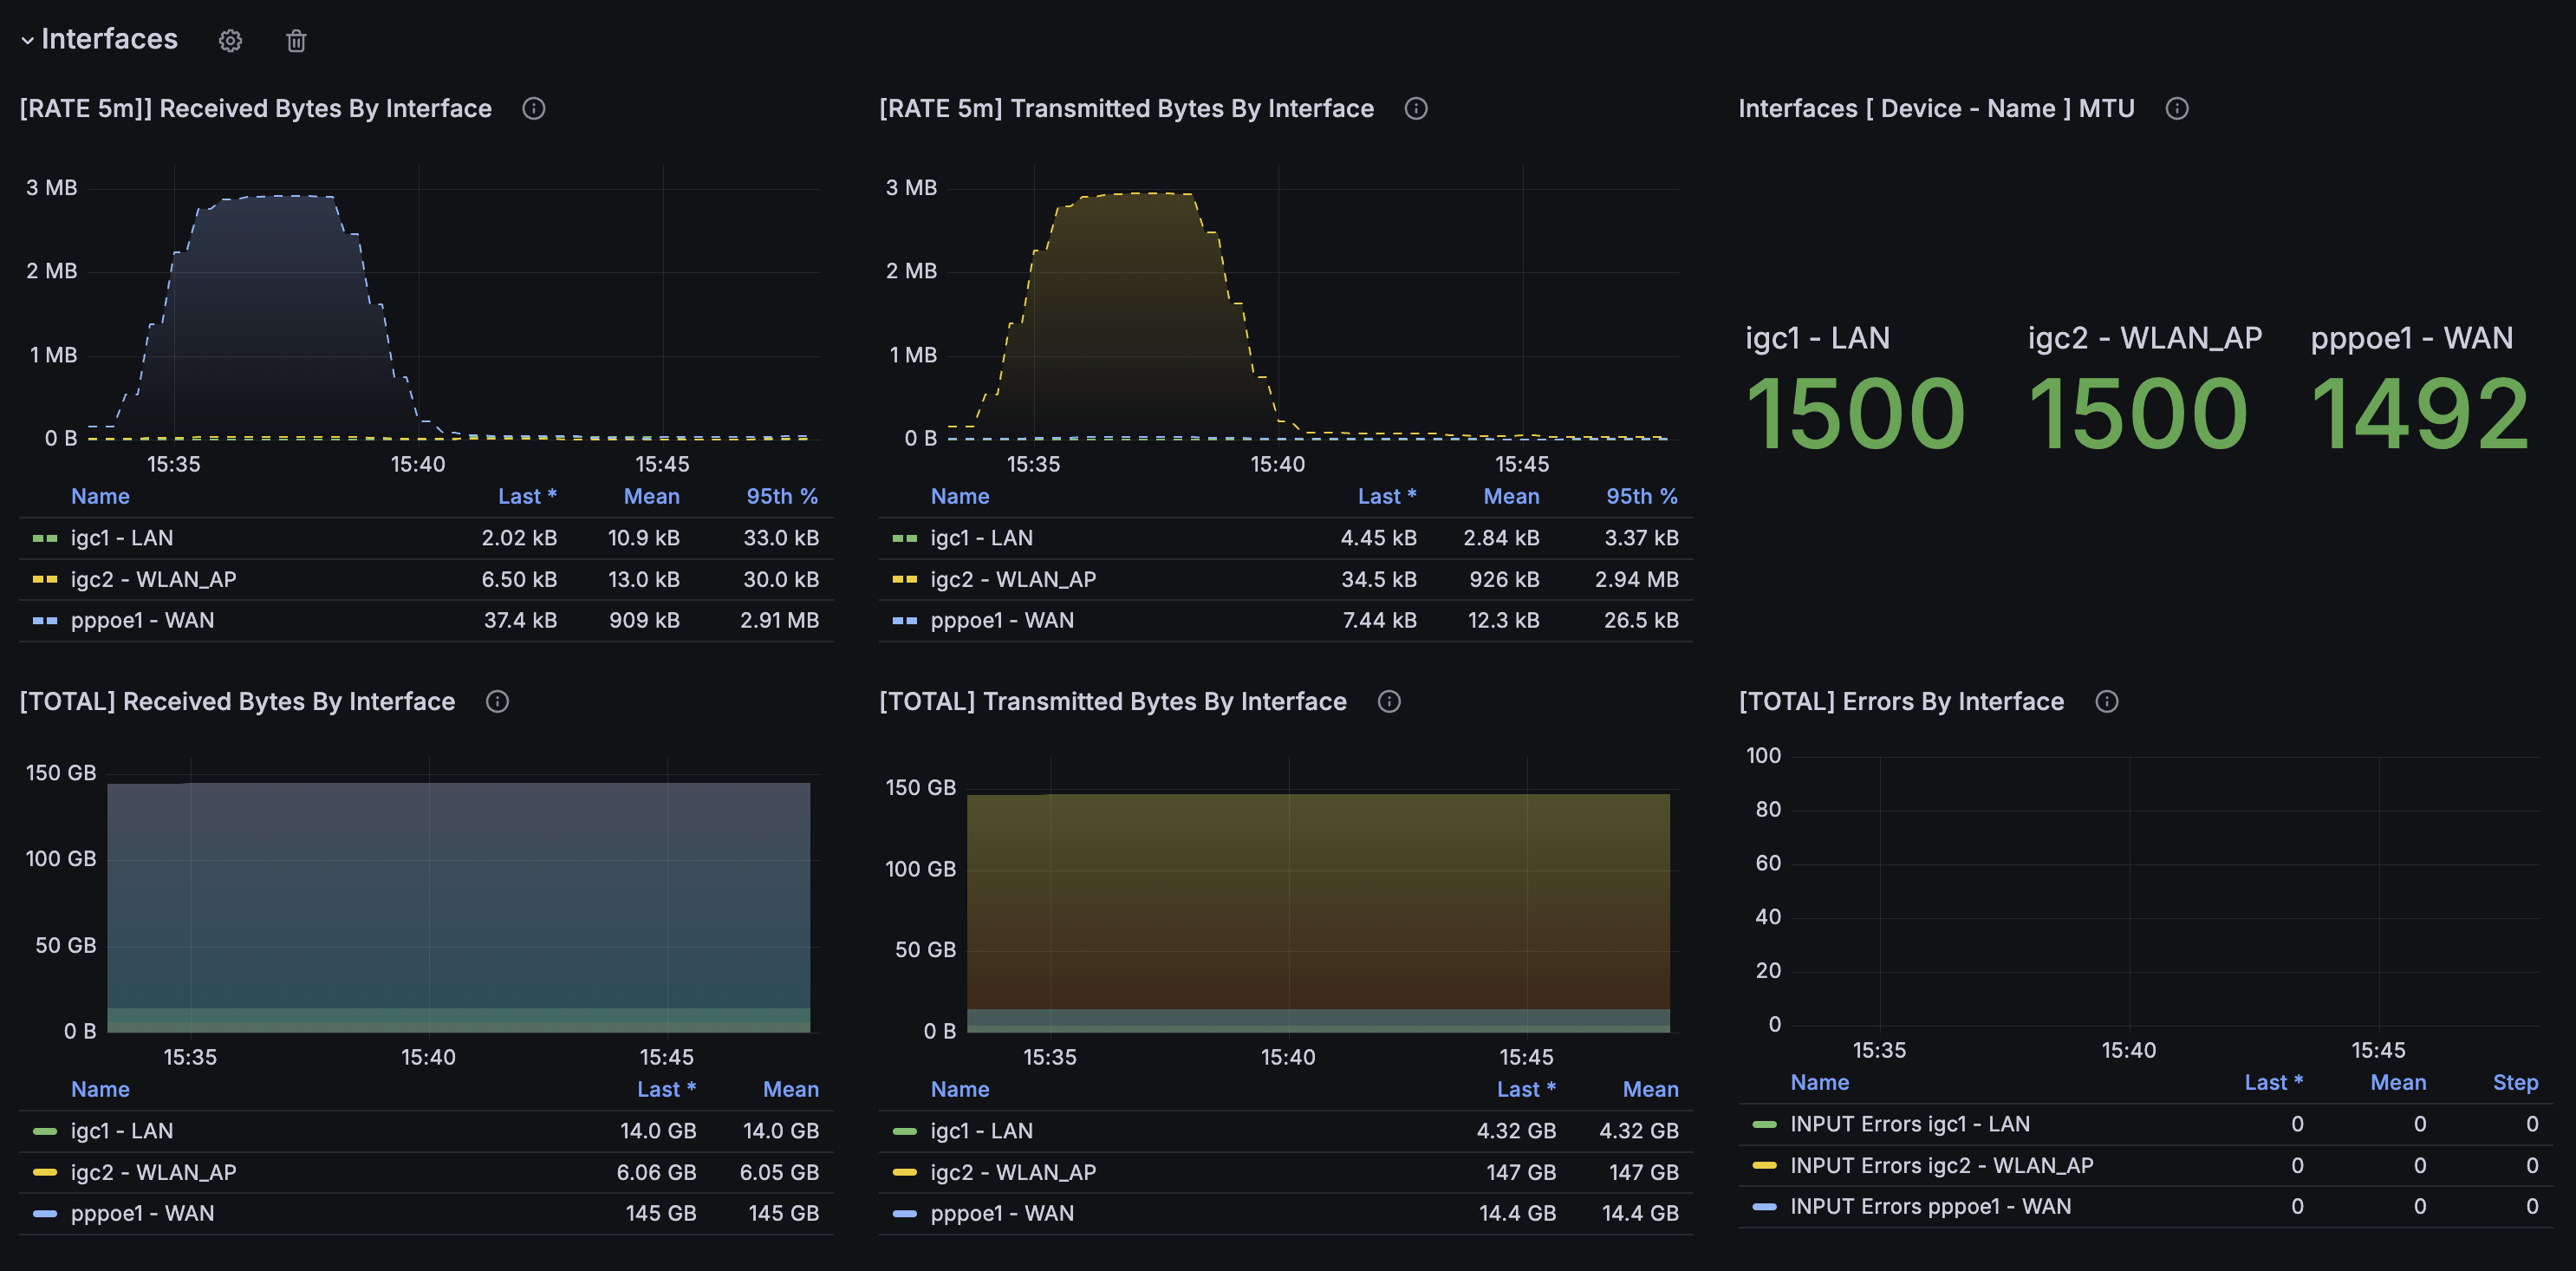
opnsense_interfaces_input_errors_total
opnsense_interfaces_mtu_bytes
opnsense_interfaces_received_bytes_total
opnsense_interfaces_transmitted_bytes_total
opnsense_protocol_arp_received_requests_total
opnsense_protocol_arp_sent_requests_total
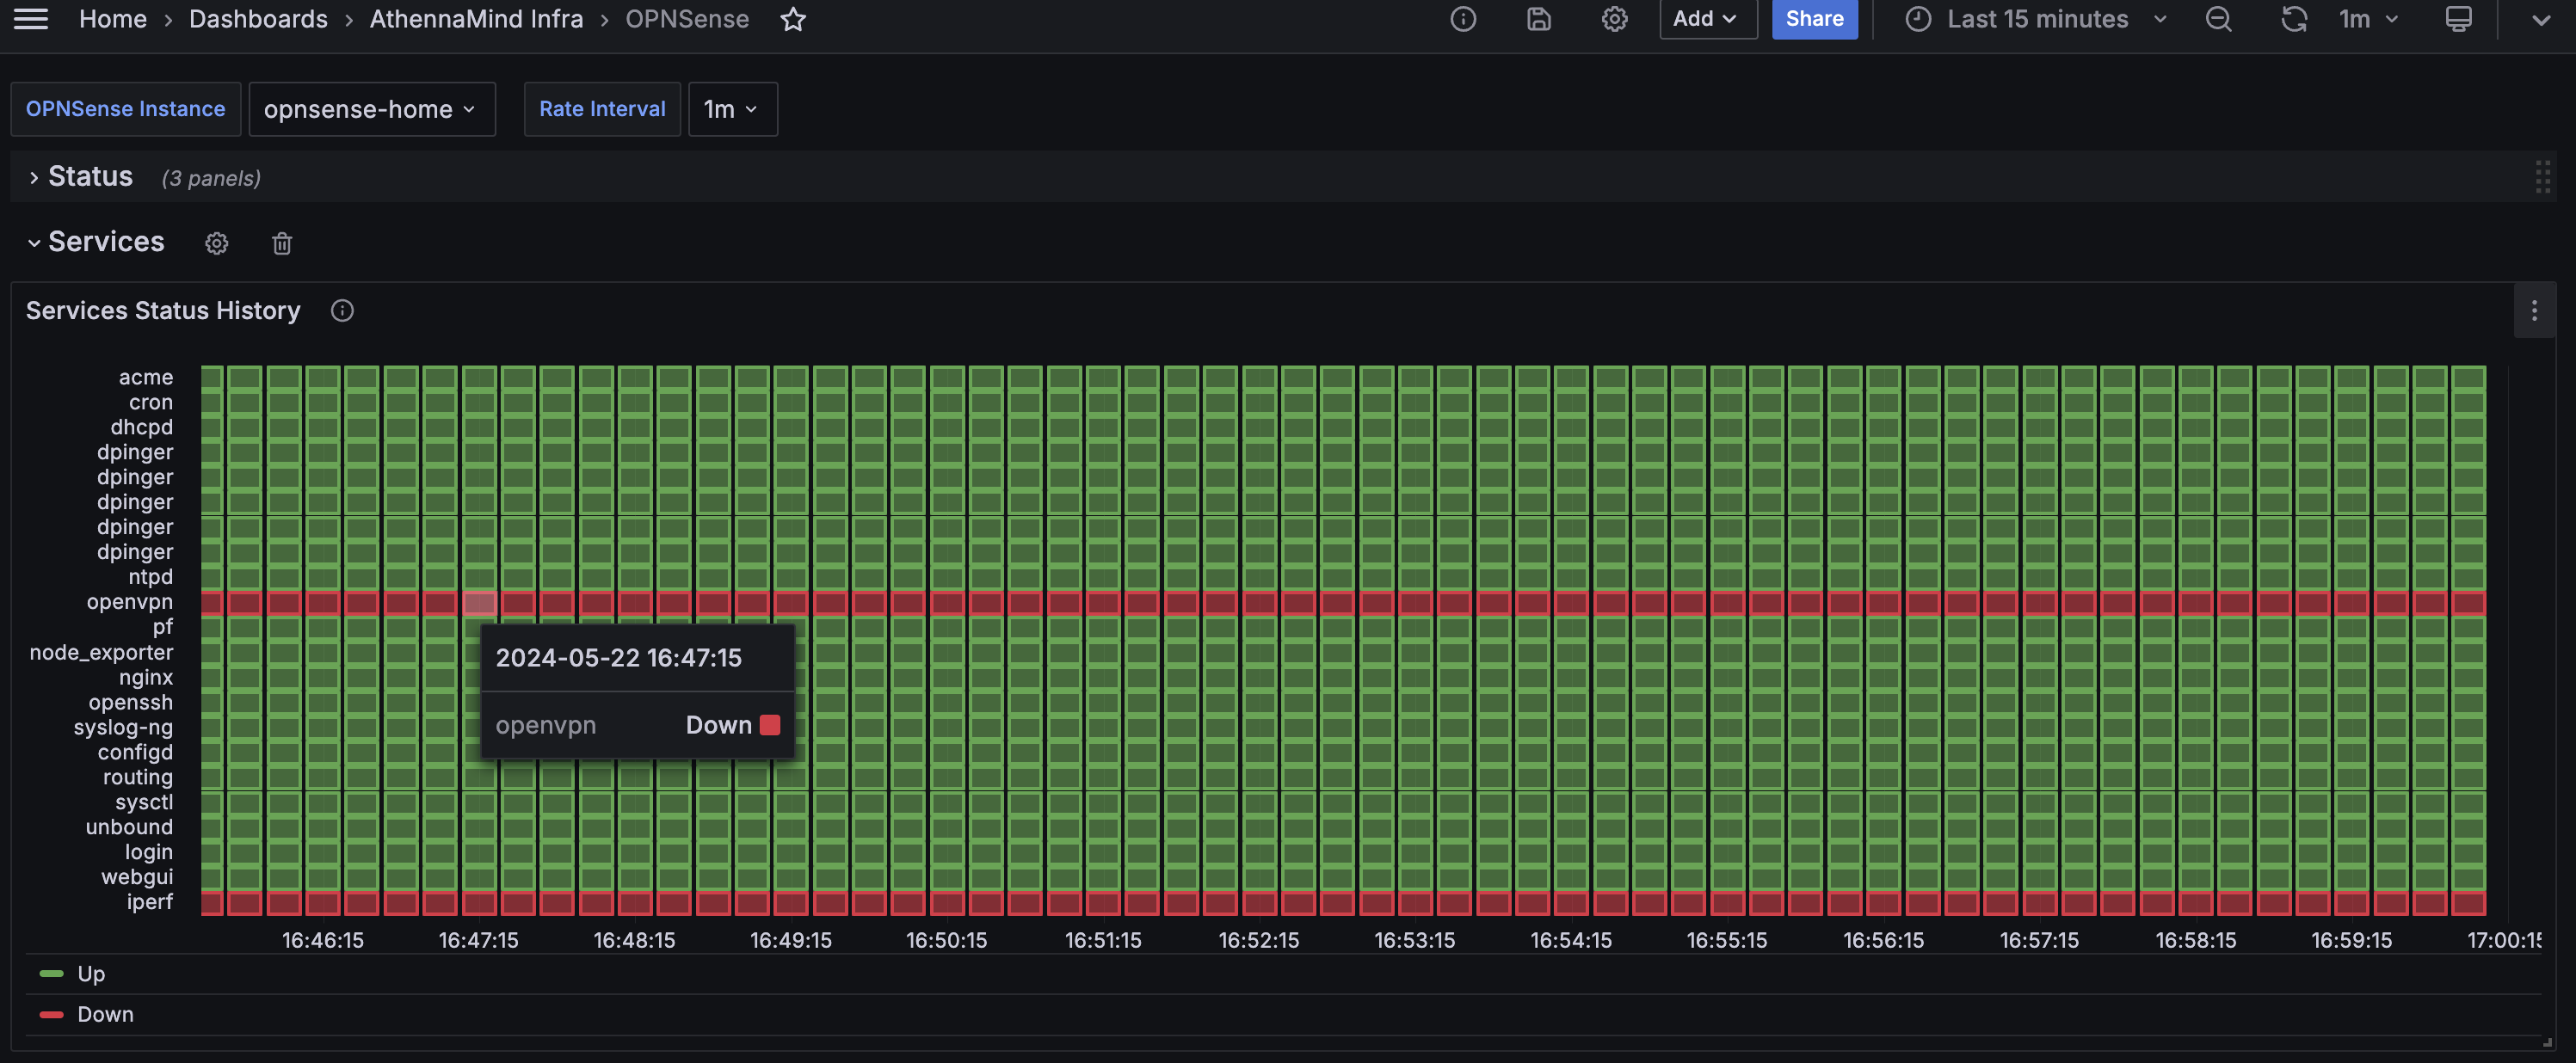
opnsense_services_status
opnsense_up
rate_interval
Get Dashboard✕
Download
Copy to Clipboard