OpenVPN Metrics 1,7851,785 5.0 (1 reviews)
4/22/2020
4/22/2020
1
>=6.7.2
Prometheus
Description
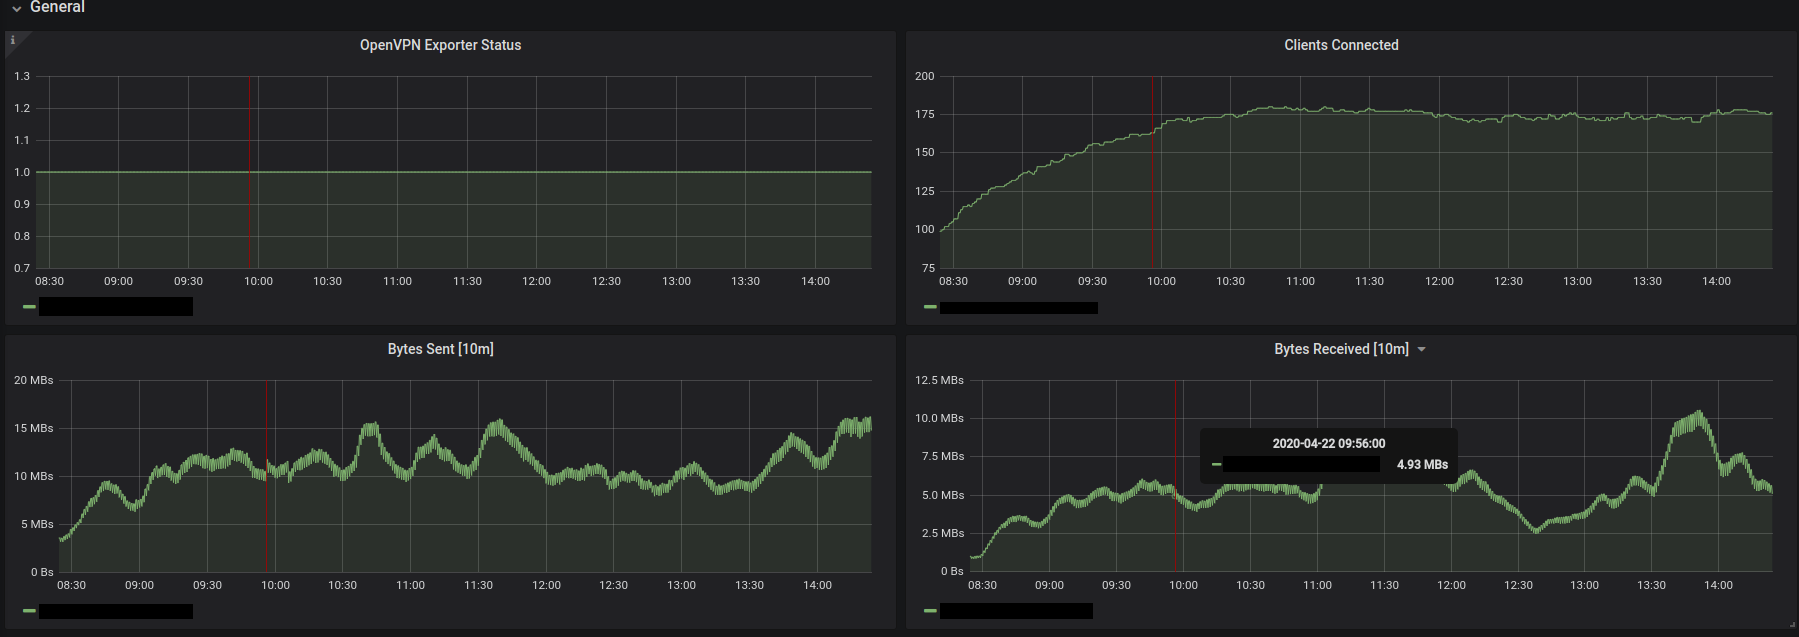
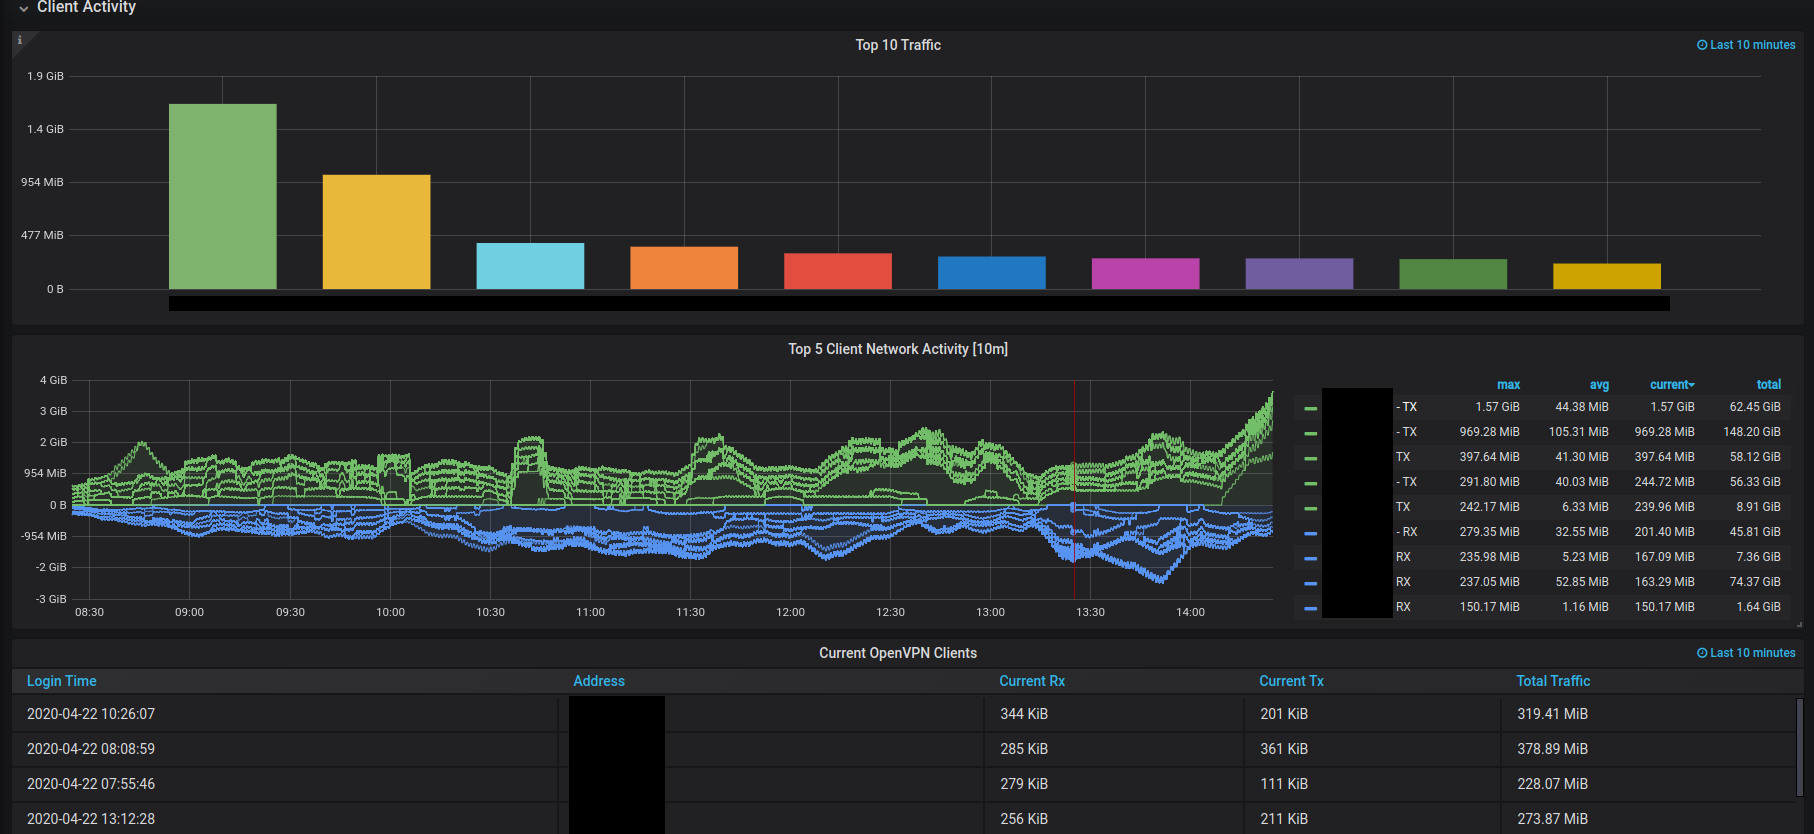
Simple OpenVPN Metrics dashboard for Prometheus openvpn_exporter
Screenshots

Used Metrics 66
openvpn_openvpn_server_connected_clients
openvpn_server_client_received_bytes_total
openvpn_server_client_sent_bytes_total
openvpn_status_update_time_seconds
openvpn_up
topk
Get Dashboard✕
Download
Copy to Clipboard