OpenTelemetry & Tempo 2,5392,539
Description
OpenTelemetry & Tempo Performance Monitoring
Screenshots
Used Metrics 6363
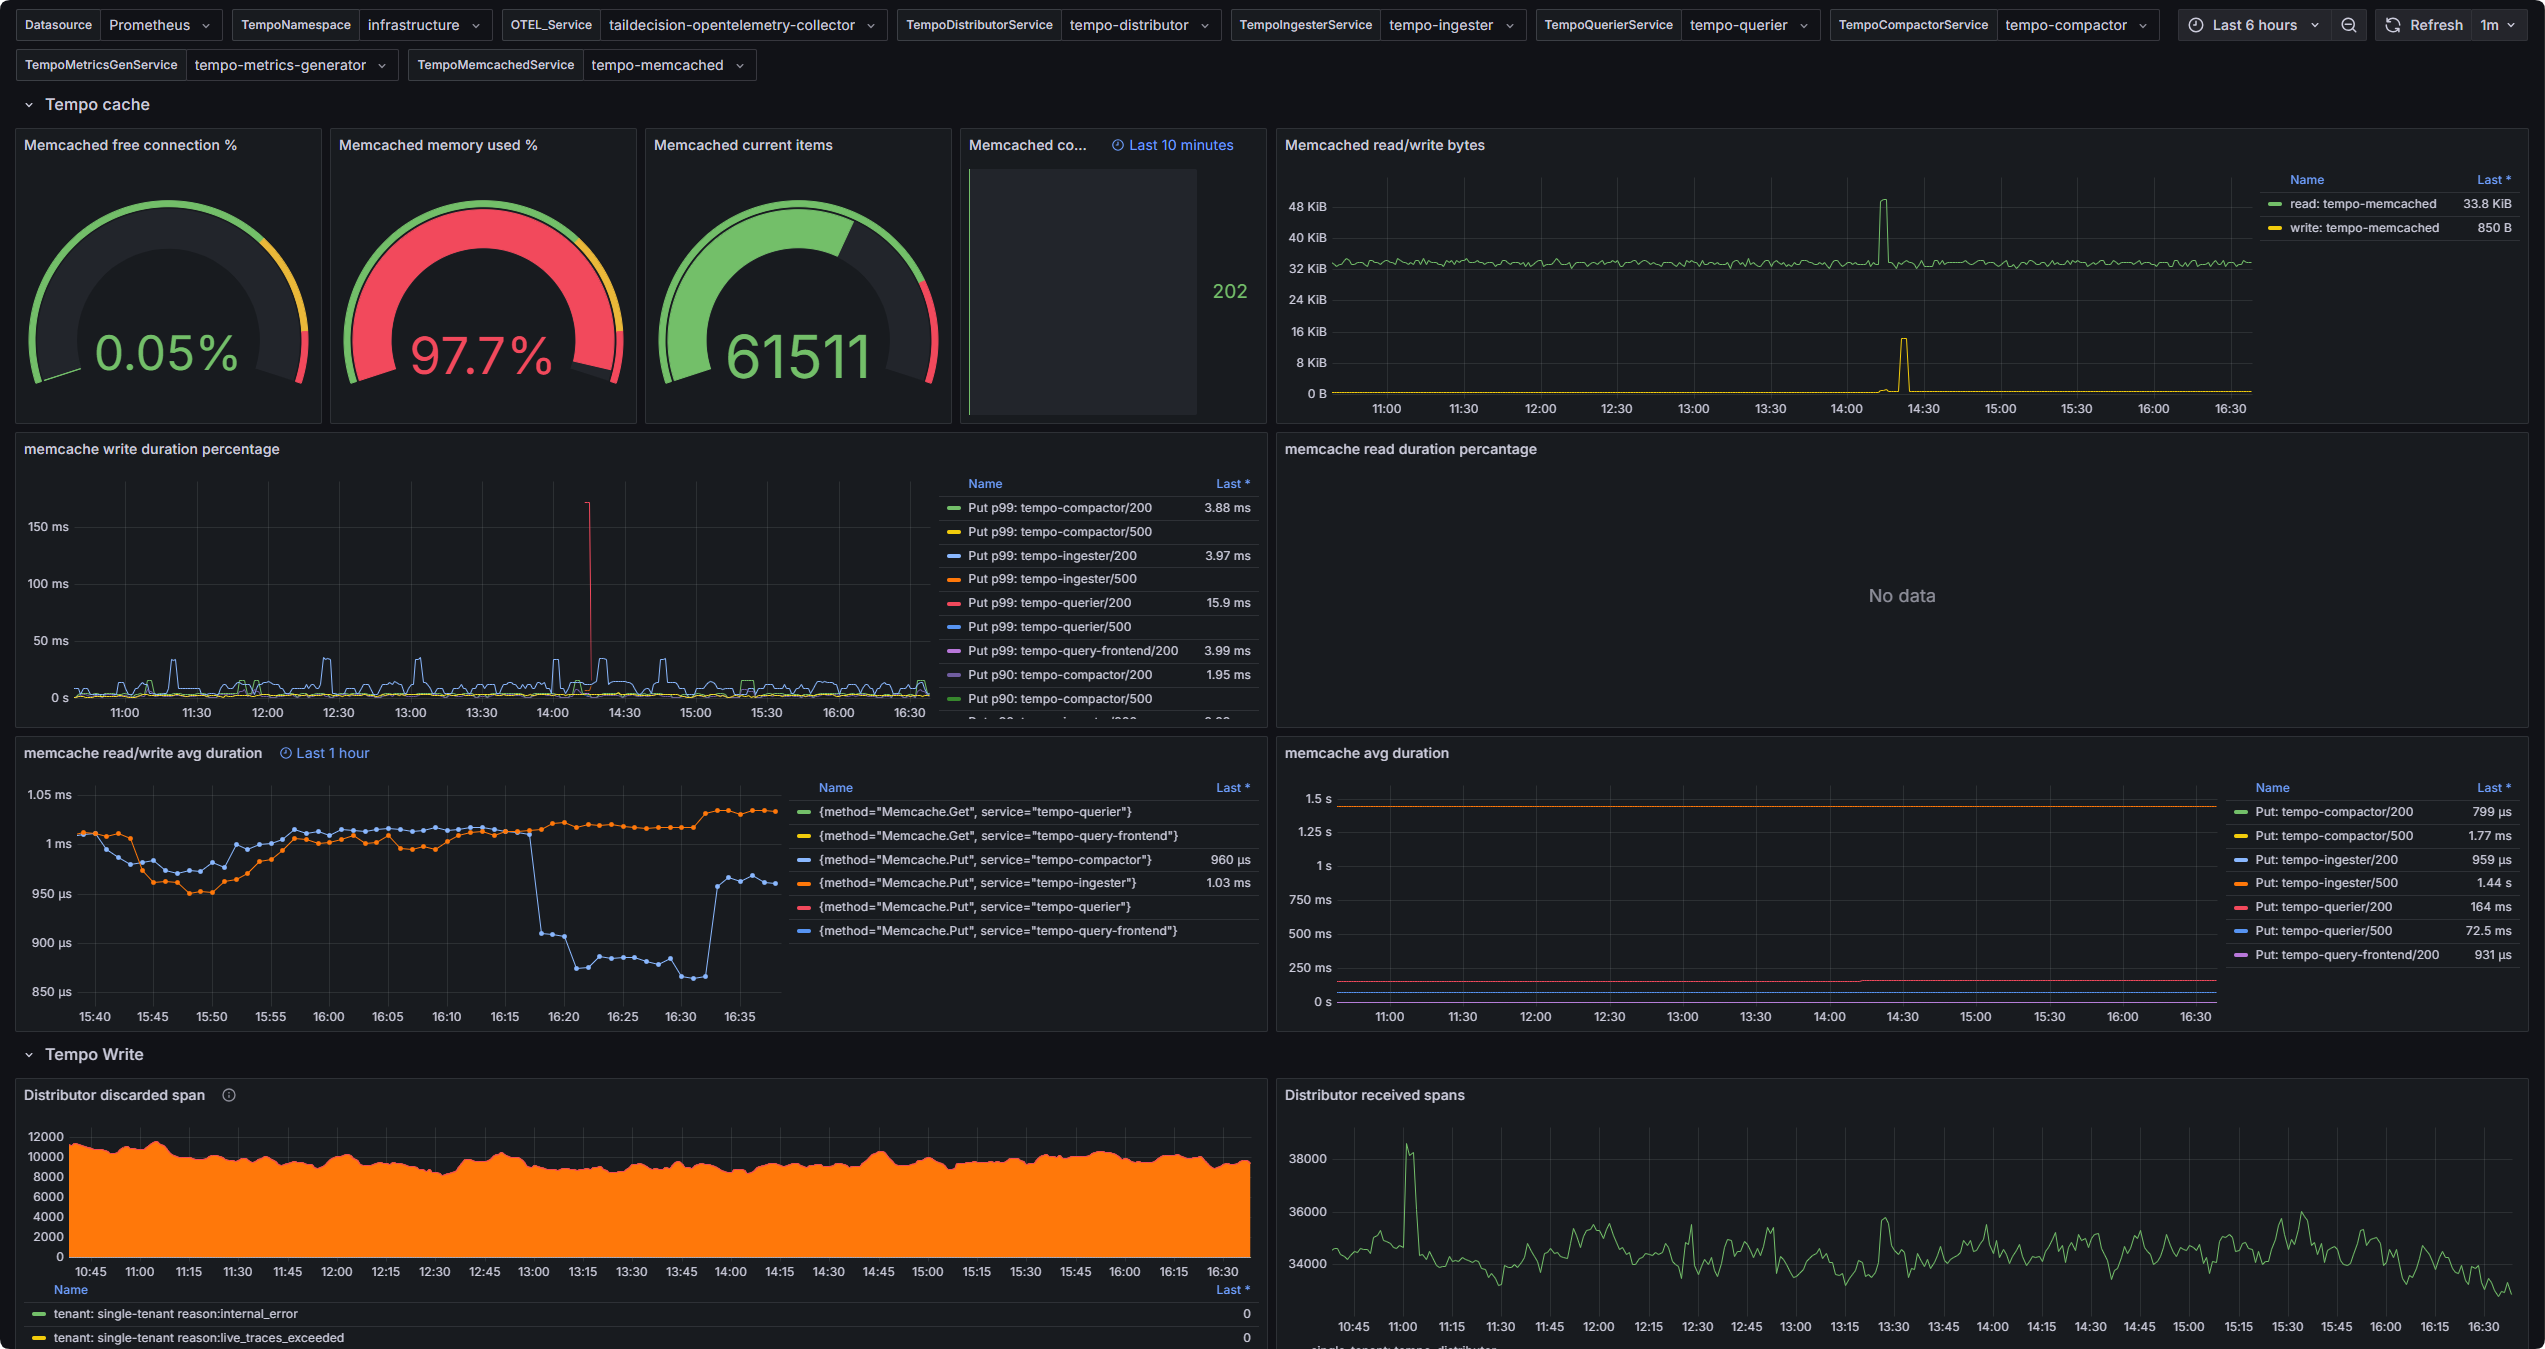
memcached_commands_total
memcached_current_bytes
memcached_current_connections
memcached_current_items
memcached_limit_bytes
memcached_max_connections
memcached_read_bytes_total
memcached_written_bytes_total
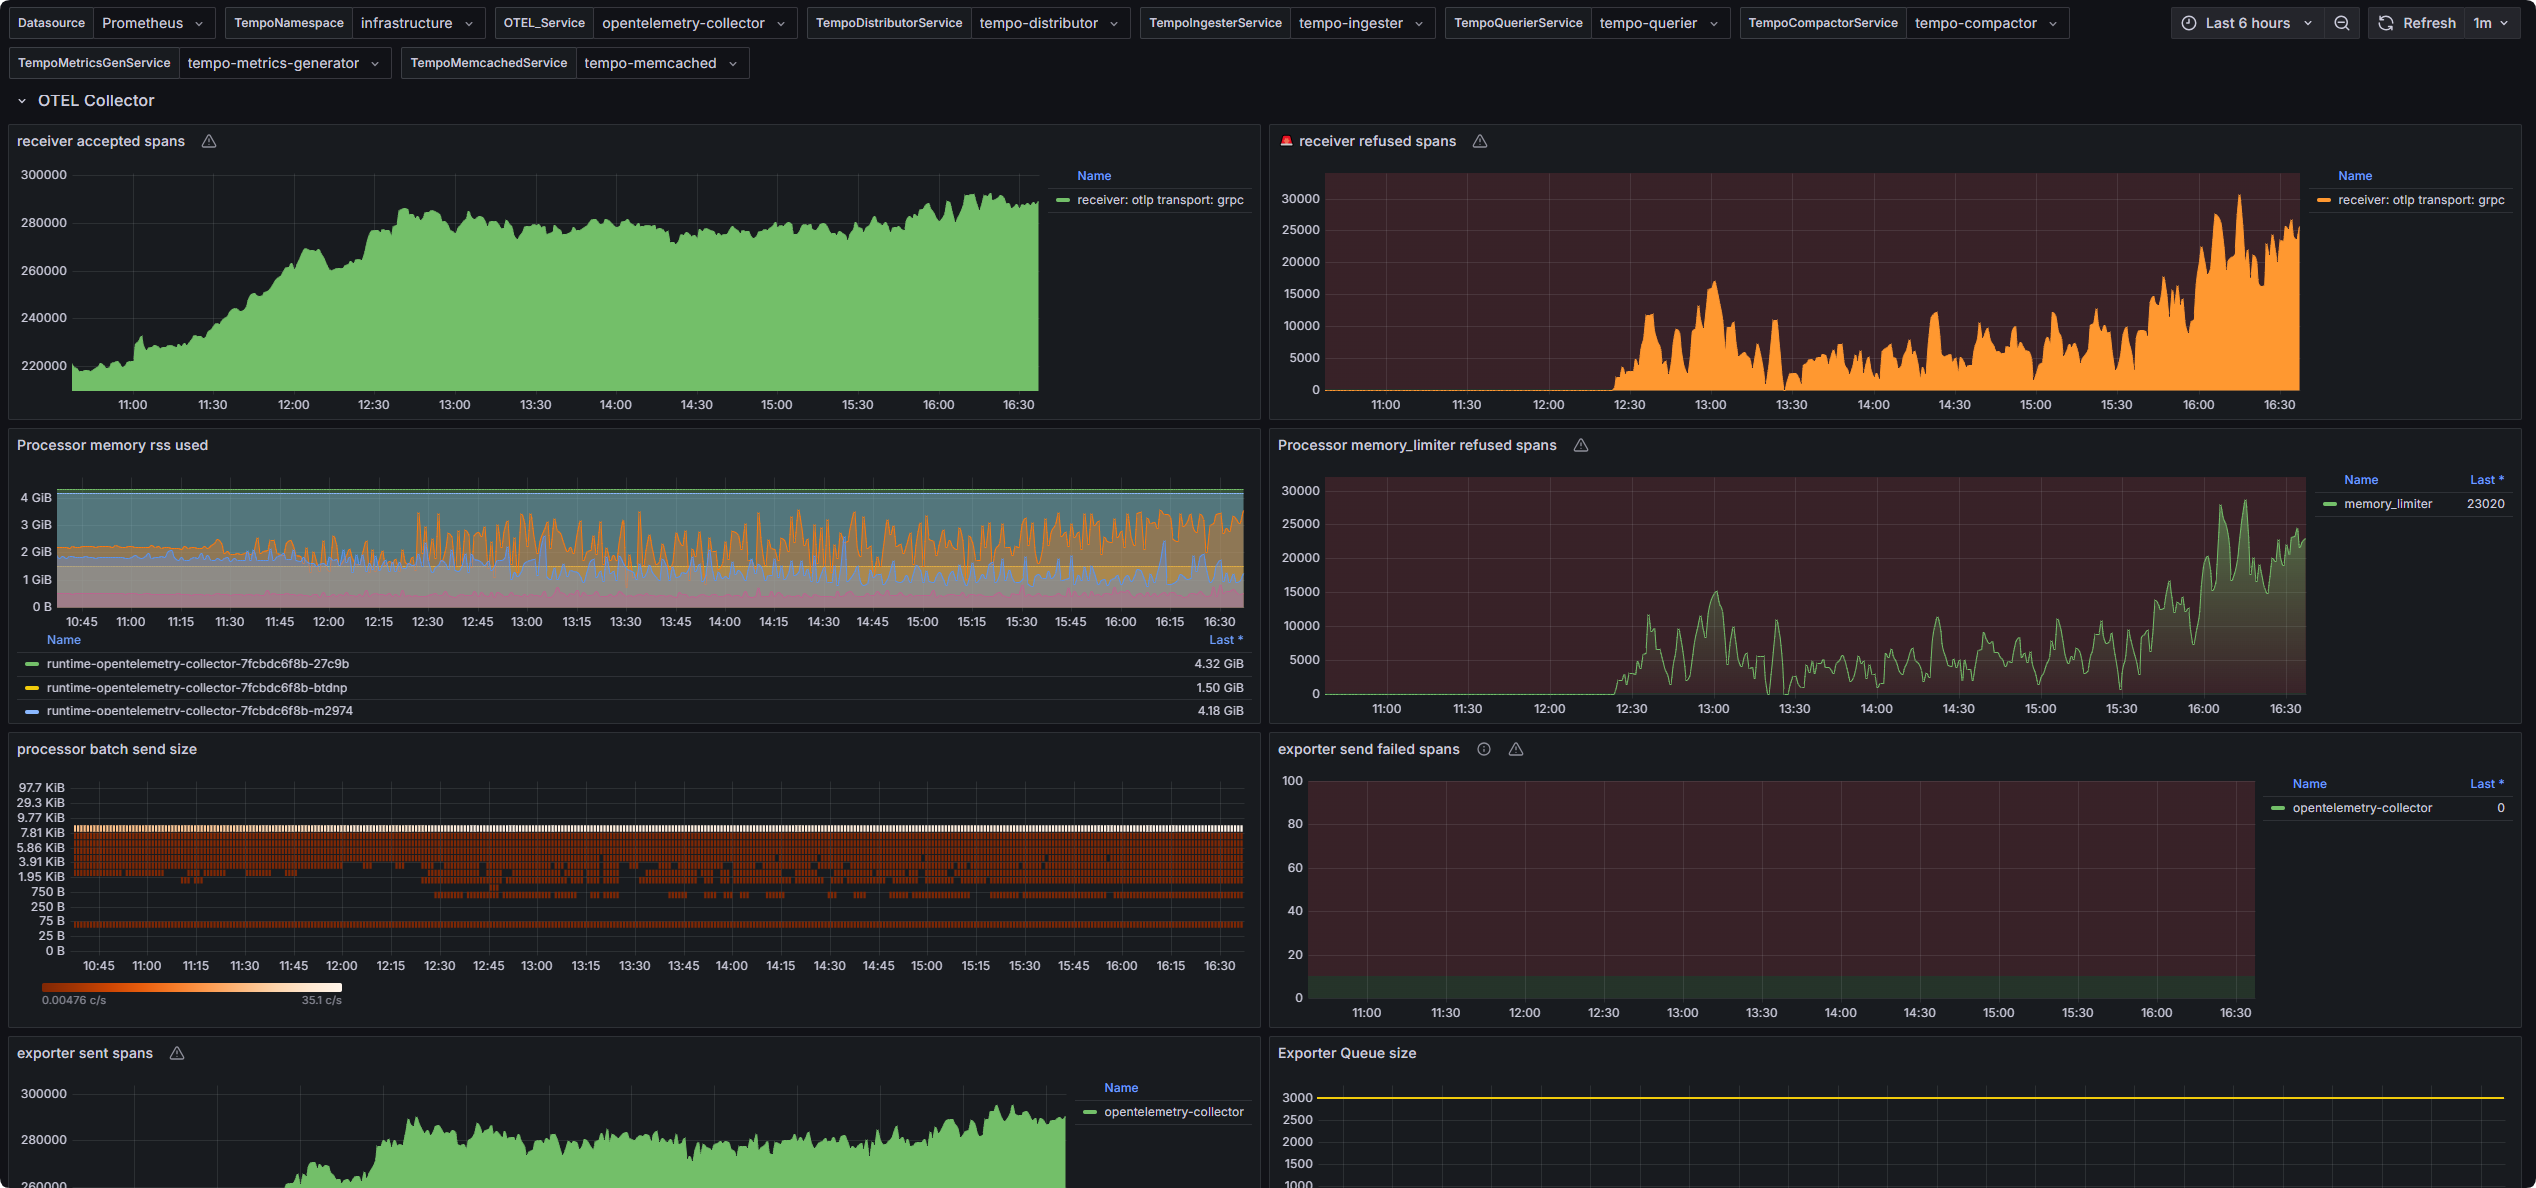
otelcol_exporter_queue_capacity
otelcol_exporter_queue_size
otelcol_exporter_send_failed_spans
otelcol_exporter_sent_spans
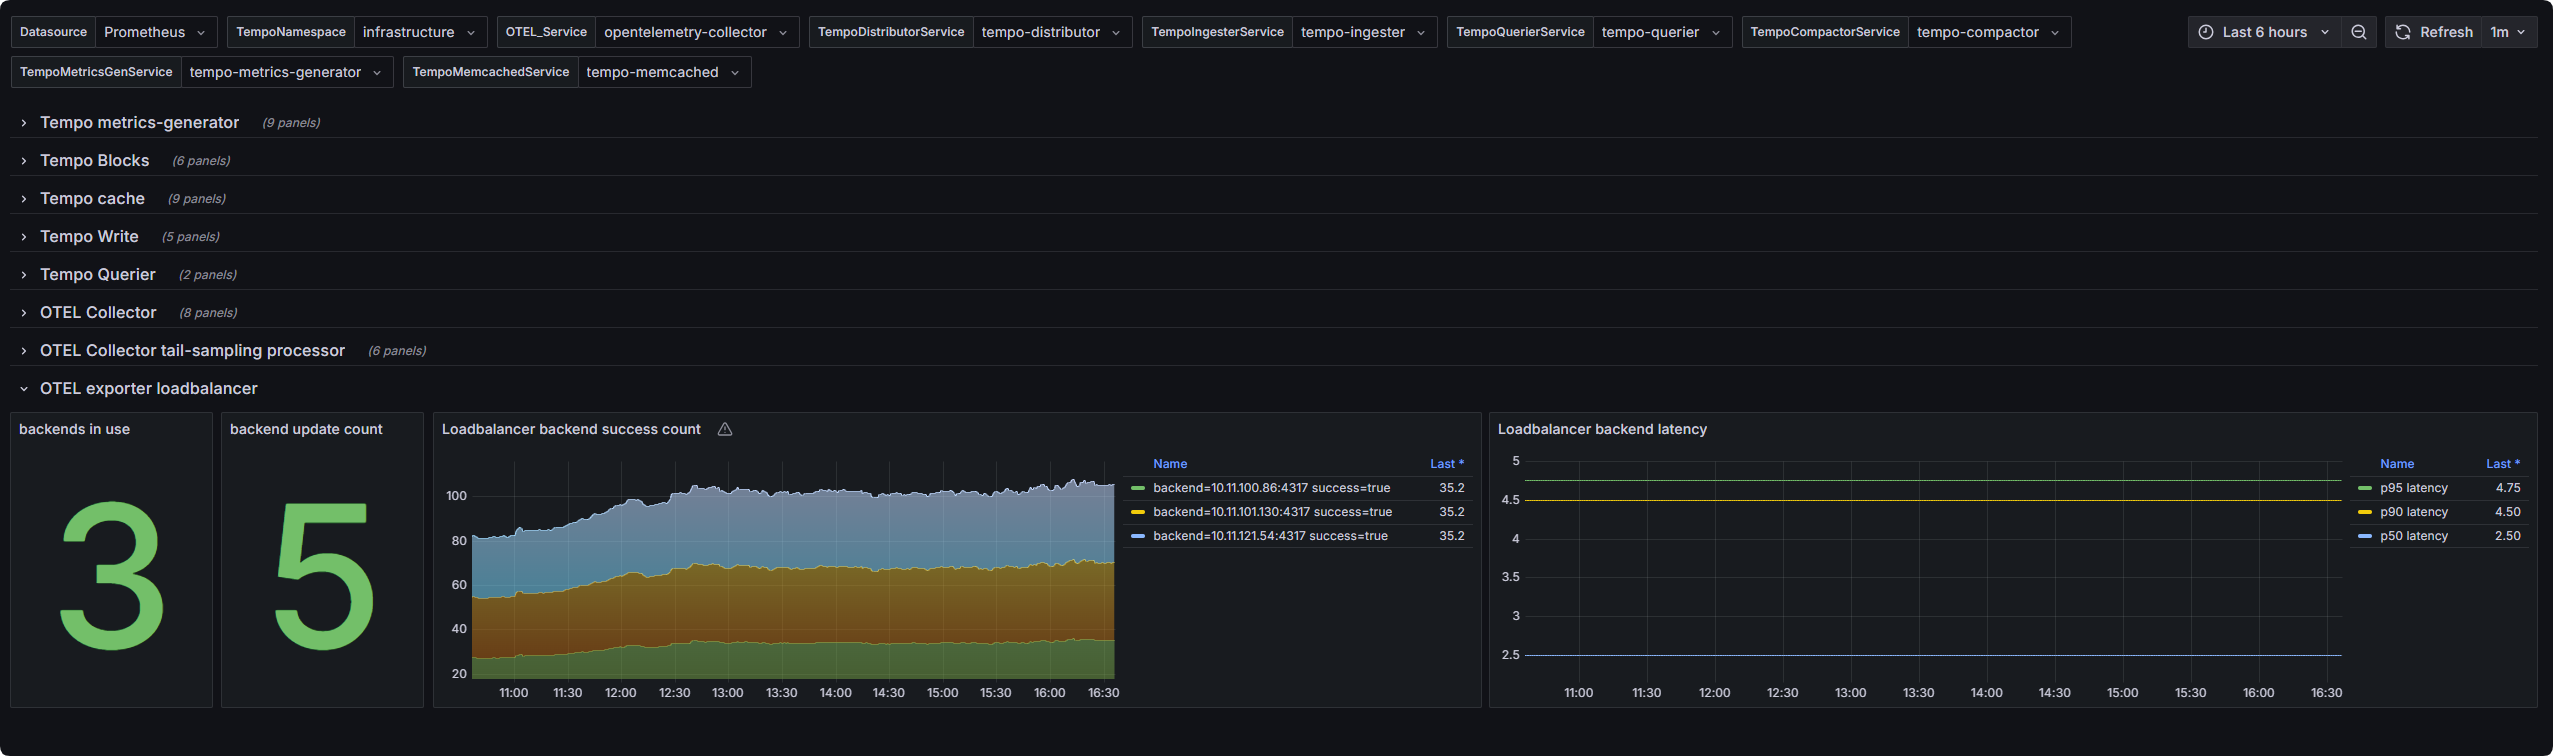
otelcol_loadbalancer_backend_latency_bucket
otelcol_loadbalancer_backend_outcome
otelcol_loadbalancer_num_backend_updates
otelcol_loadbalancer_num_backends
otelcol_process_memory_rss
otelcol_process_runtime_total_sys_memory_bytes
otelcol_processor_batch_batch_send_size_bucket
otelcol_processor_refused_spans
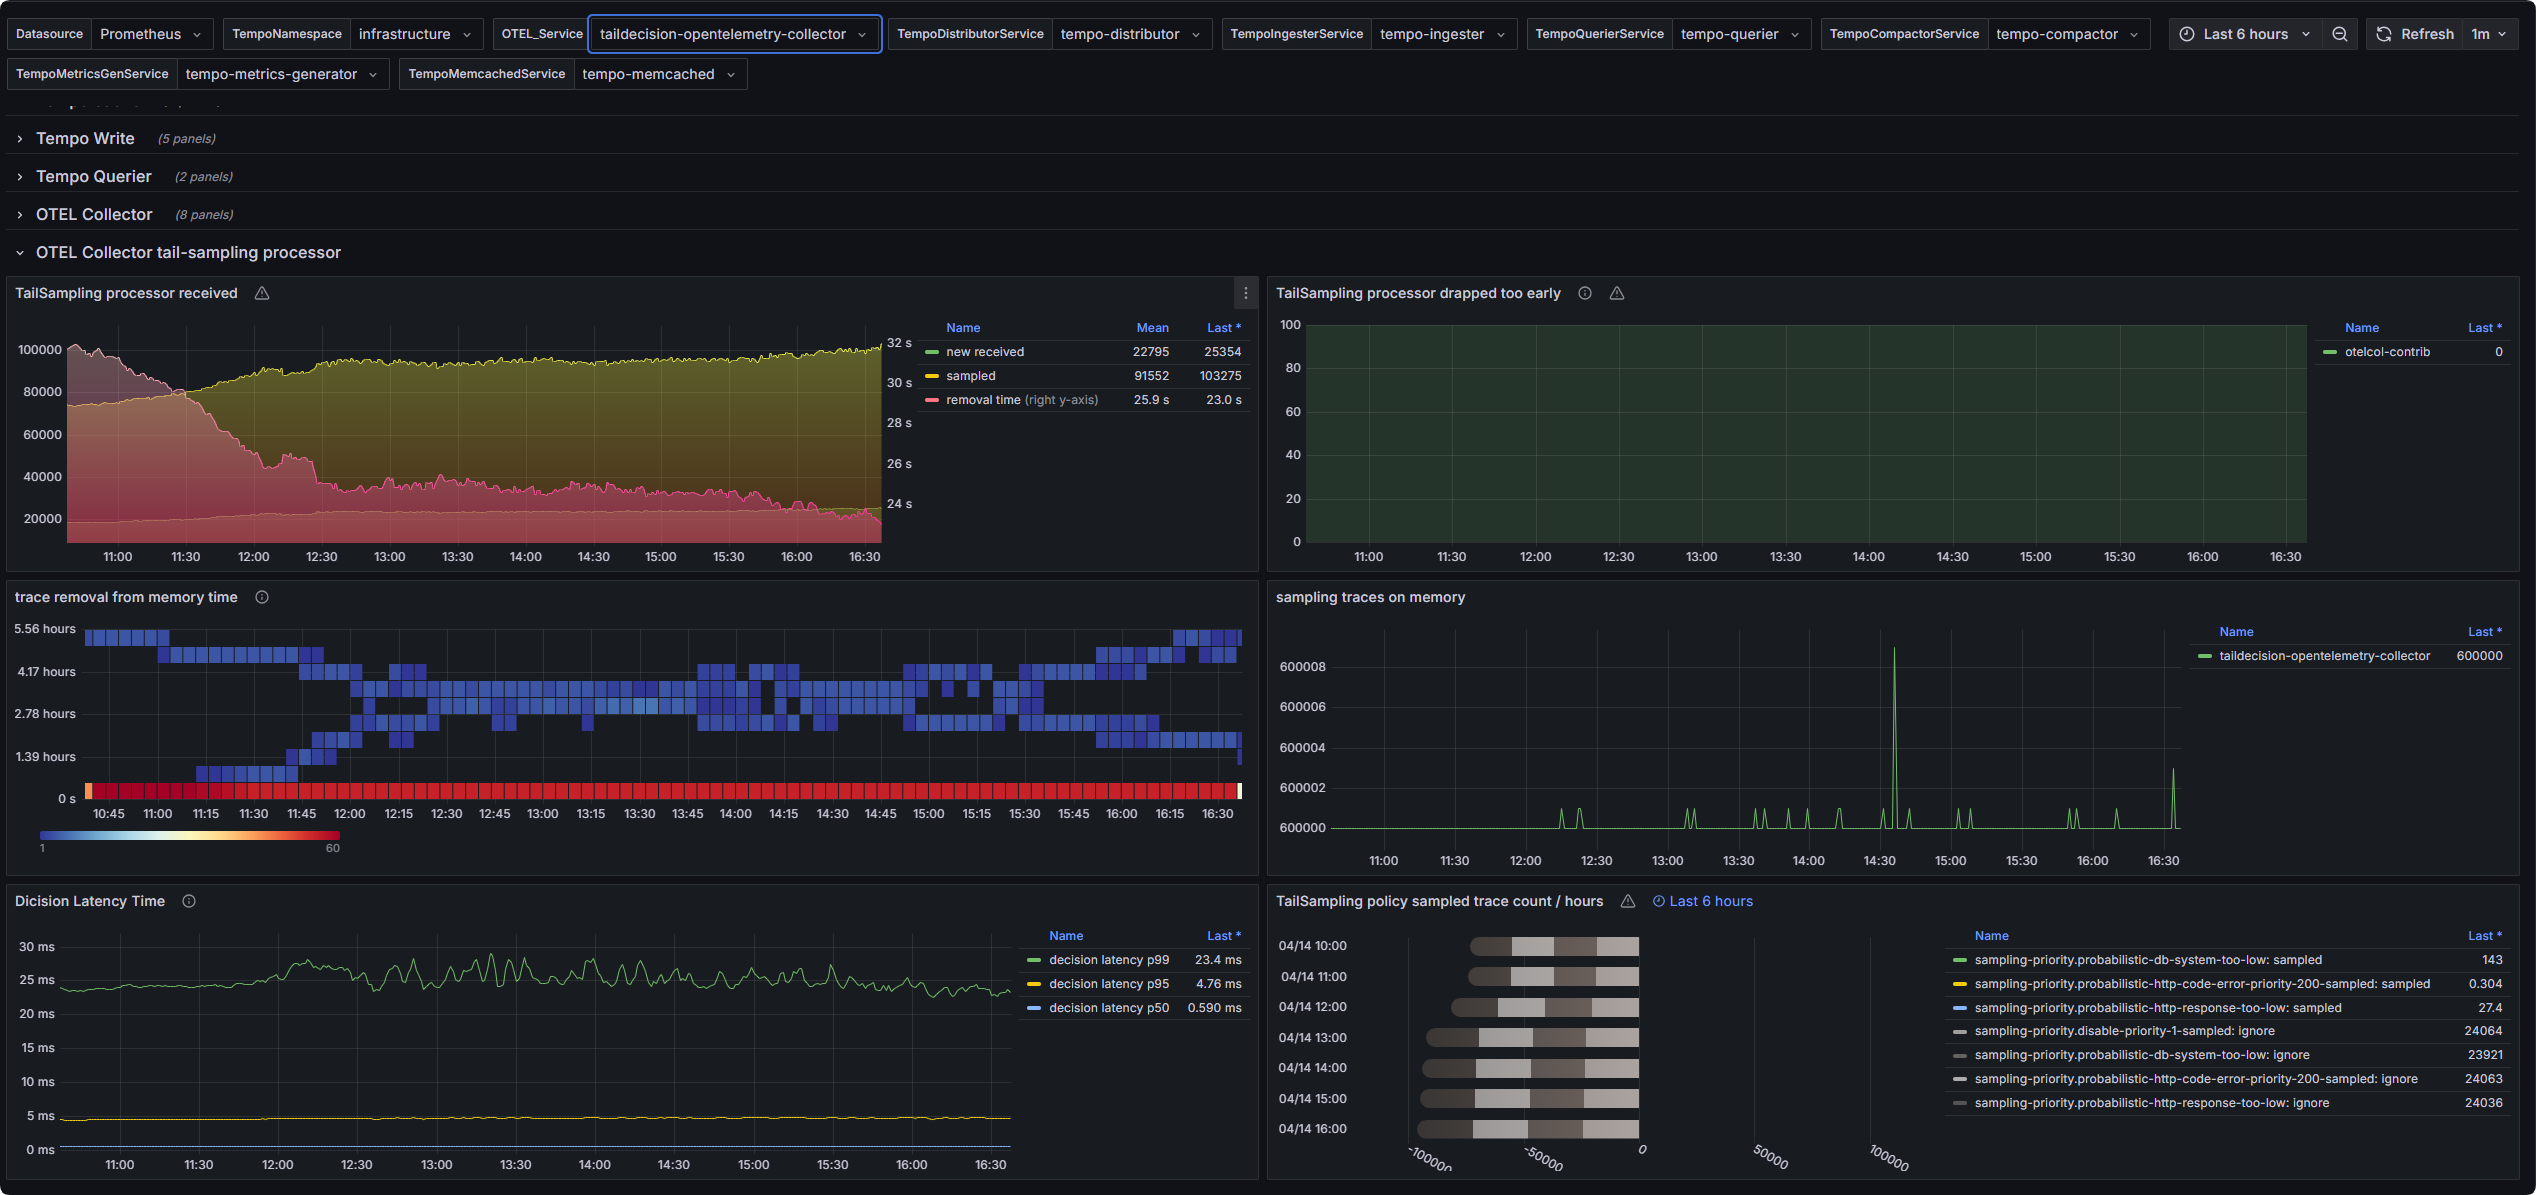
otelcol_processor_tail_sampling_count_traces_sampled
otelcol_processor_tail_sampling_new_trace_id_received
otelcol_processor_tail_sampling_sampling_decision_latency_bucket
otelcol_processor_tail_sampling_sampling_trace_dropped_too_early
otelcol_processor_tail_sampling_sampling_trace_removal_age_bucket
otelcol_processor_tail_sampling_sampling_trace_removal_age_count
otelcol_processor_tail_sampling_sampling_trace_removal_age_sum
otelcol_processor_tail_sampling_sampling_traces_on_memory
otelcol_receiver_accepted_spans
otelcol_receiver_refused_spans
prometheus_remote_storage_exemplars_dropped_total
prometheus_remote_storage_exemplars_failed_total
prometheus_remote_storage_samples_dropped_total
prometheus_remote_storage_samples_failed_total
tempo_discarded_spans_total
tempo_distributor_bytes_received_total
tempo_distributor_metrics_generator_pushes_failures_total
tempo_distributor_metrics_generator_pushes_total
tempo_distributor_queue_pushes_failures_total
tempo_distributor_queue_pushes_total
tempo_distributor_spans_received_total
tempo_ingester_blocks_cleared_total
tempo_ingester_blocks_flushed_total
tempo_ingester_failed_flushes_total
tempo_ingester_live_traces
tempo_ingester_traces_created_total
tempo_memcache_request_duration_seconds_bucket
tempo_memcache_request_duration_seconds_count
tempo_memcache_request_duration_seconds_sum
tempo_metrics_generator_active_processors
tempo_metrics_generator_registry_series_limited_total
tempo_metrics_generator_spans_discarded_total
tempo_querier_worker_request_executed_total
tempo_ring_members
tempo_warnings_total
tempodb_blocklist_length
tempodb_compaction_blocks_total
tempodb_compaction_bytes_written_total
tempodb_compaction_objects_combined_total
tempodb_compaction_objects_written_total
traces_service_graph_request_failed_total
traces_service_graph_request_total
traces_spanmetrics_calls_total