OpenTelemetry JVM Micrometer 980980
1/24/2024
4/7/2025
18
>=10.4.1
PrometheusLoki
Description
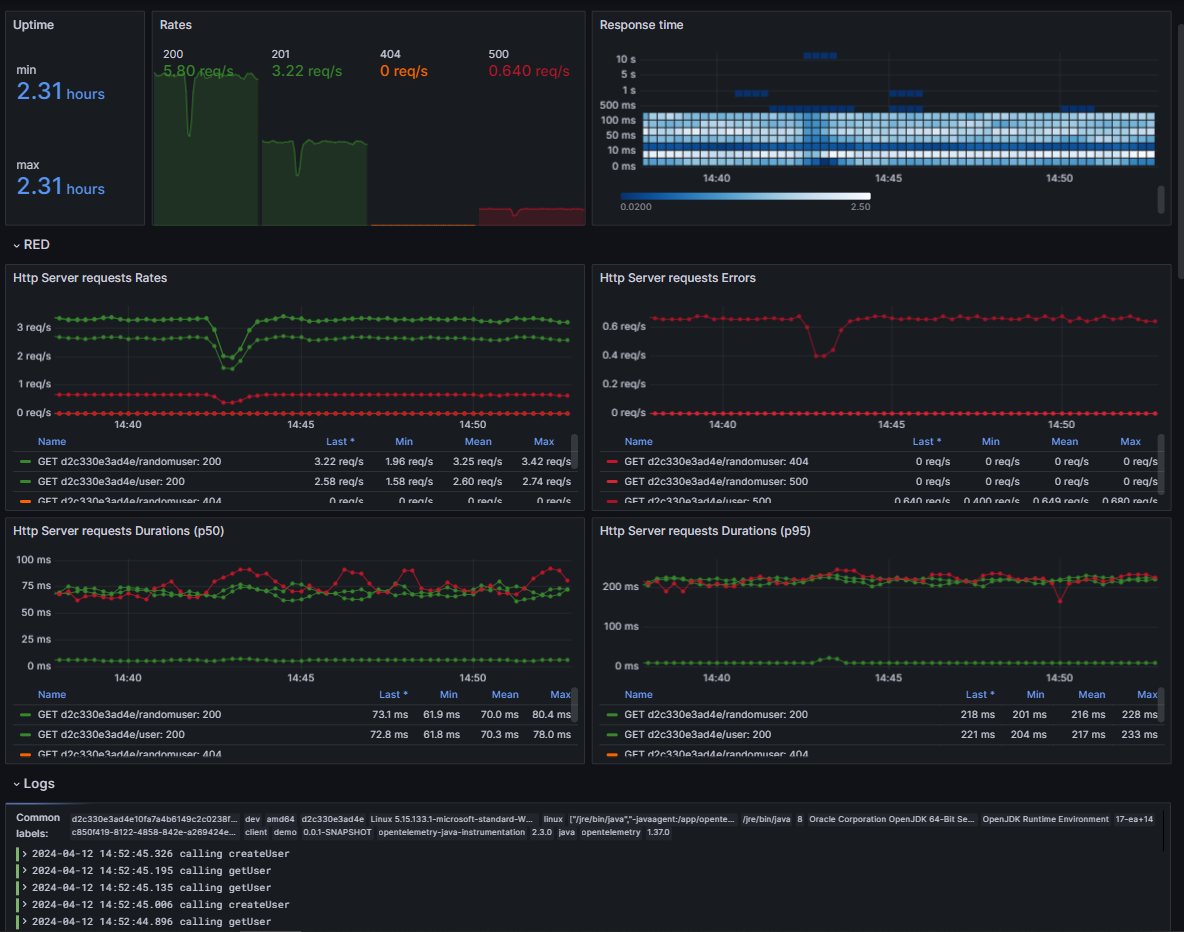
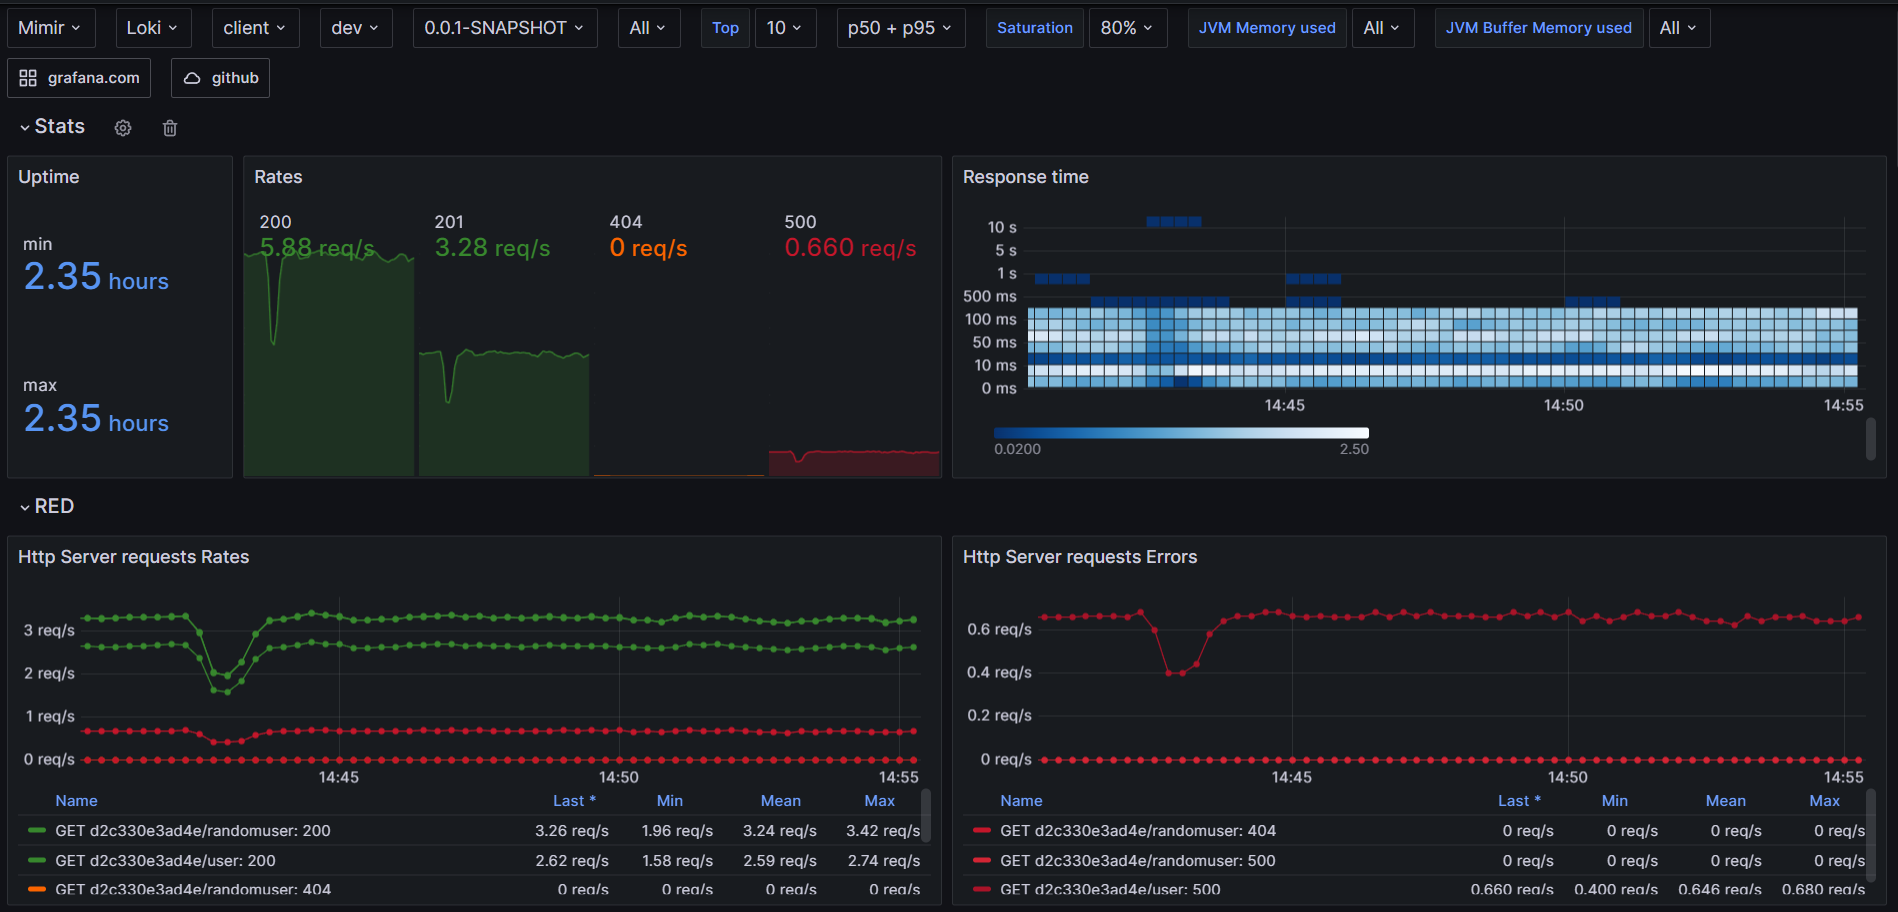
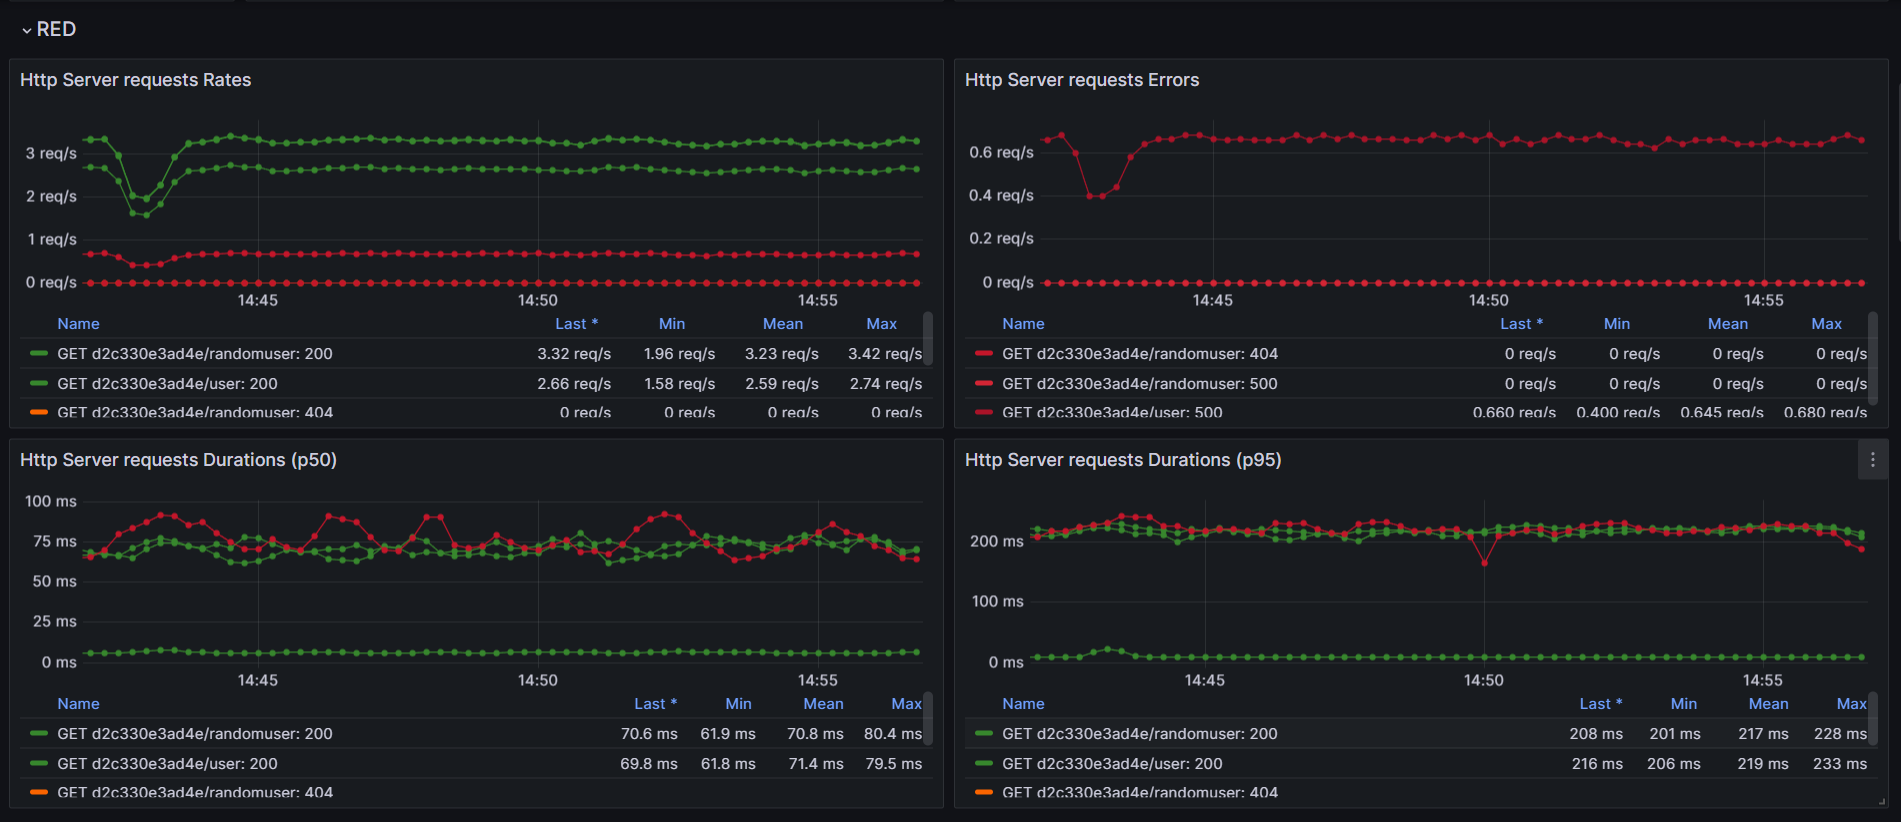
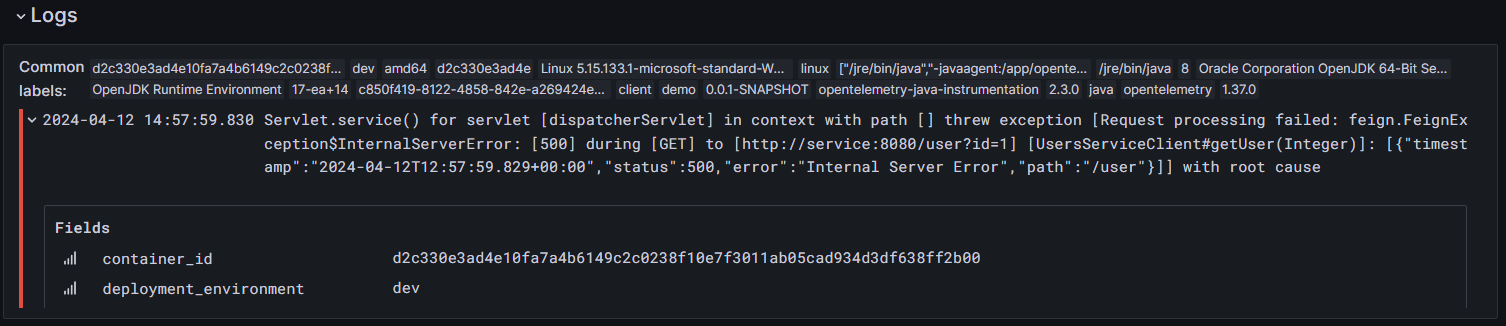
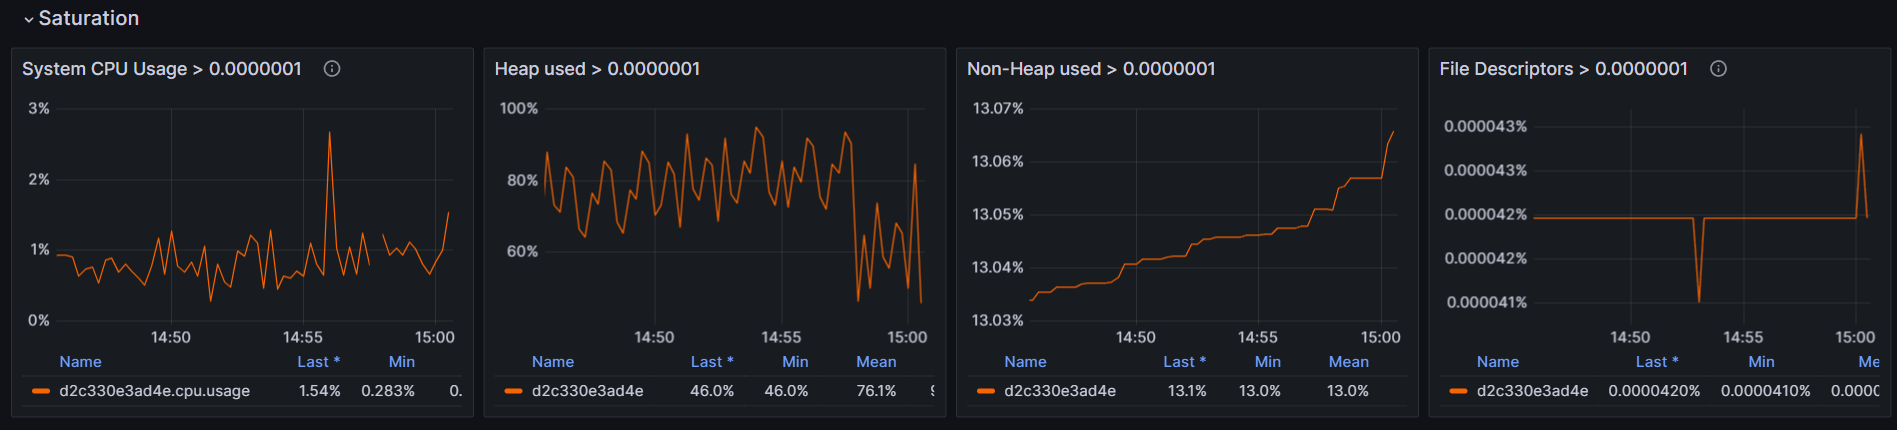
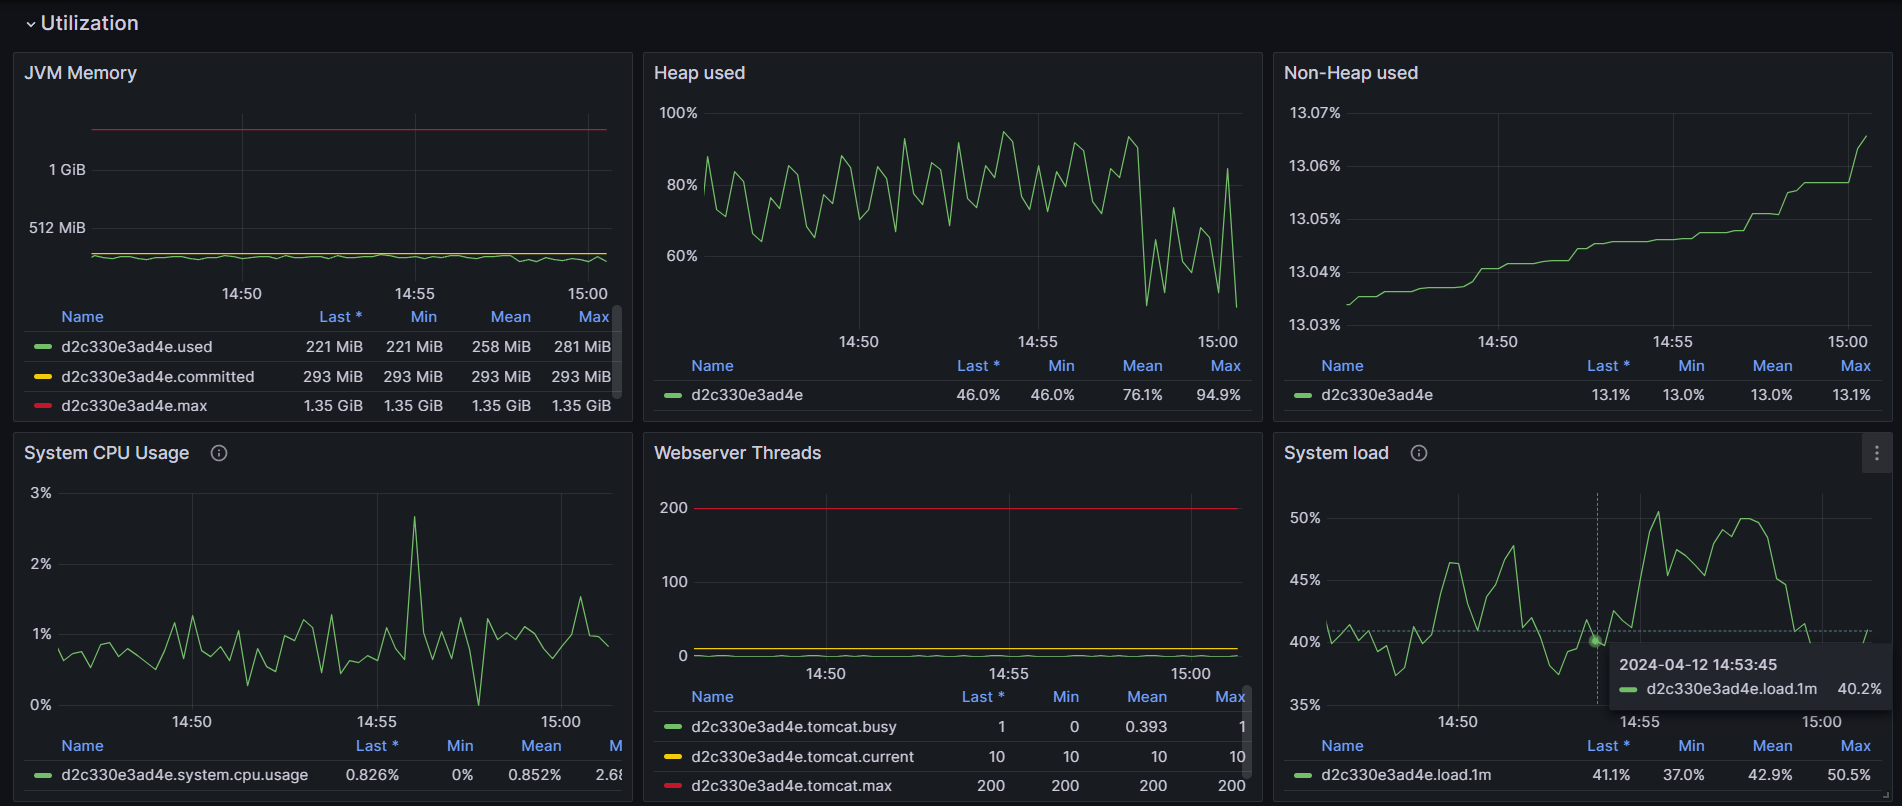
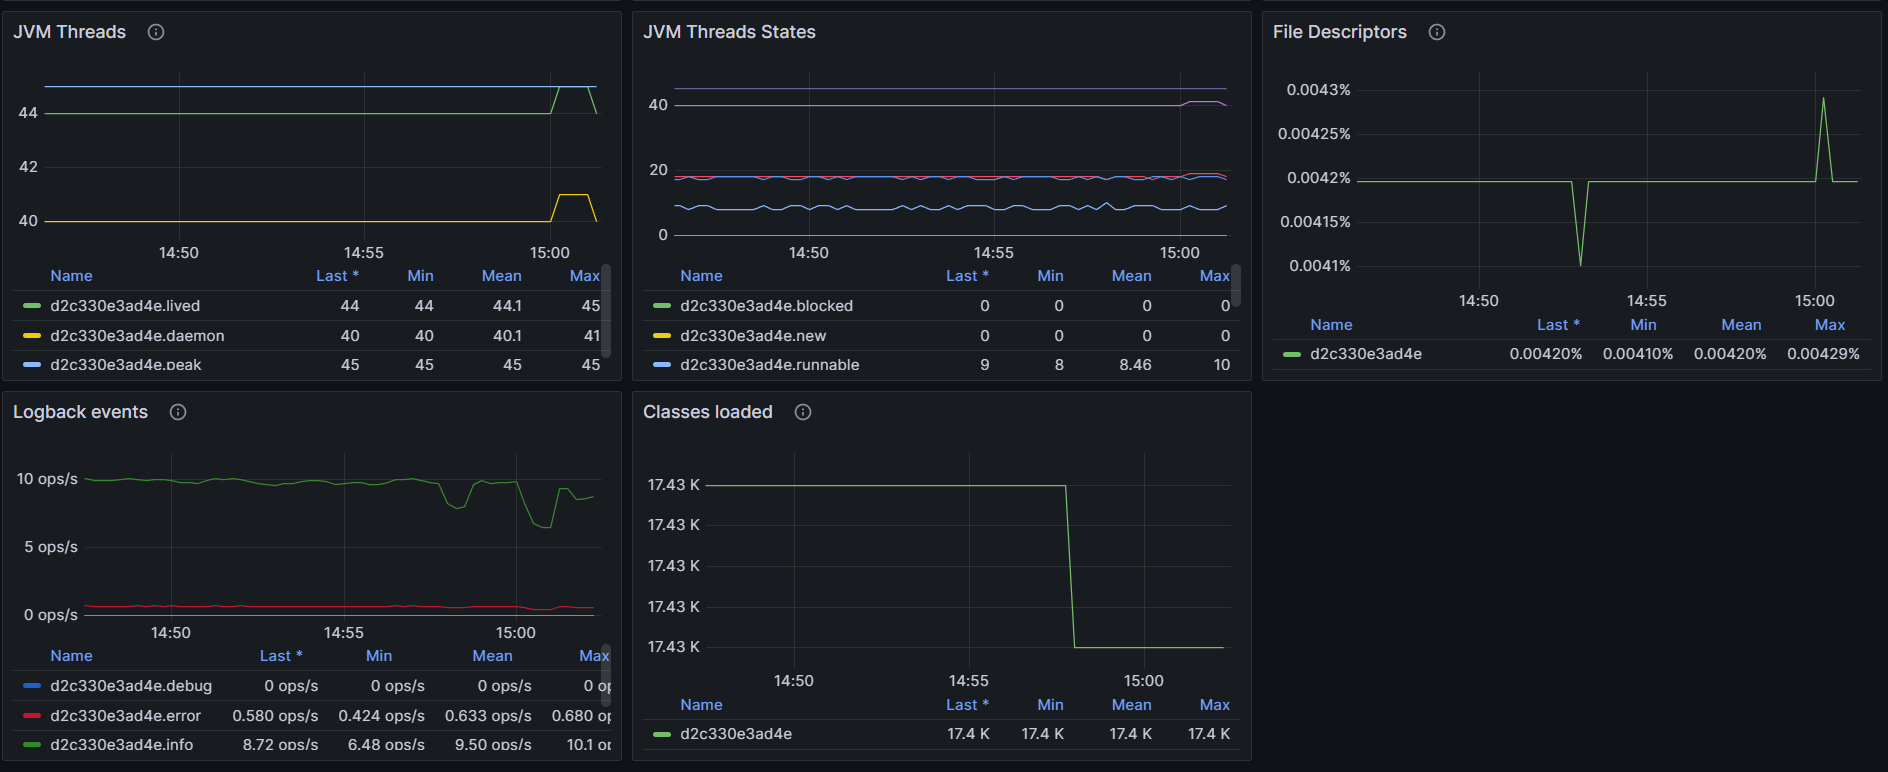
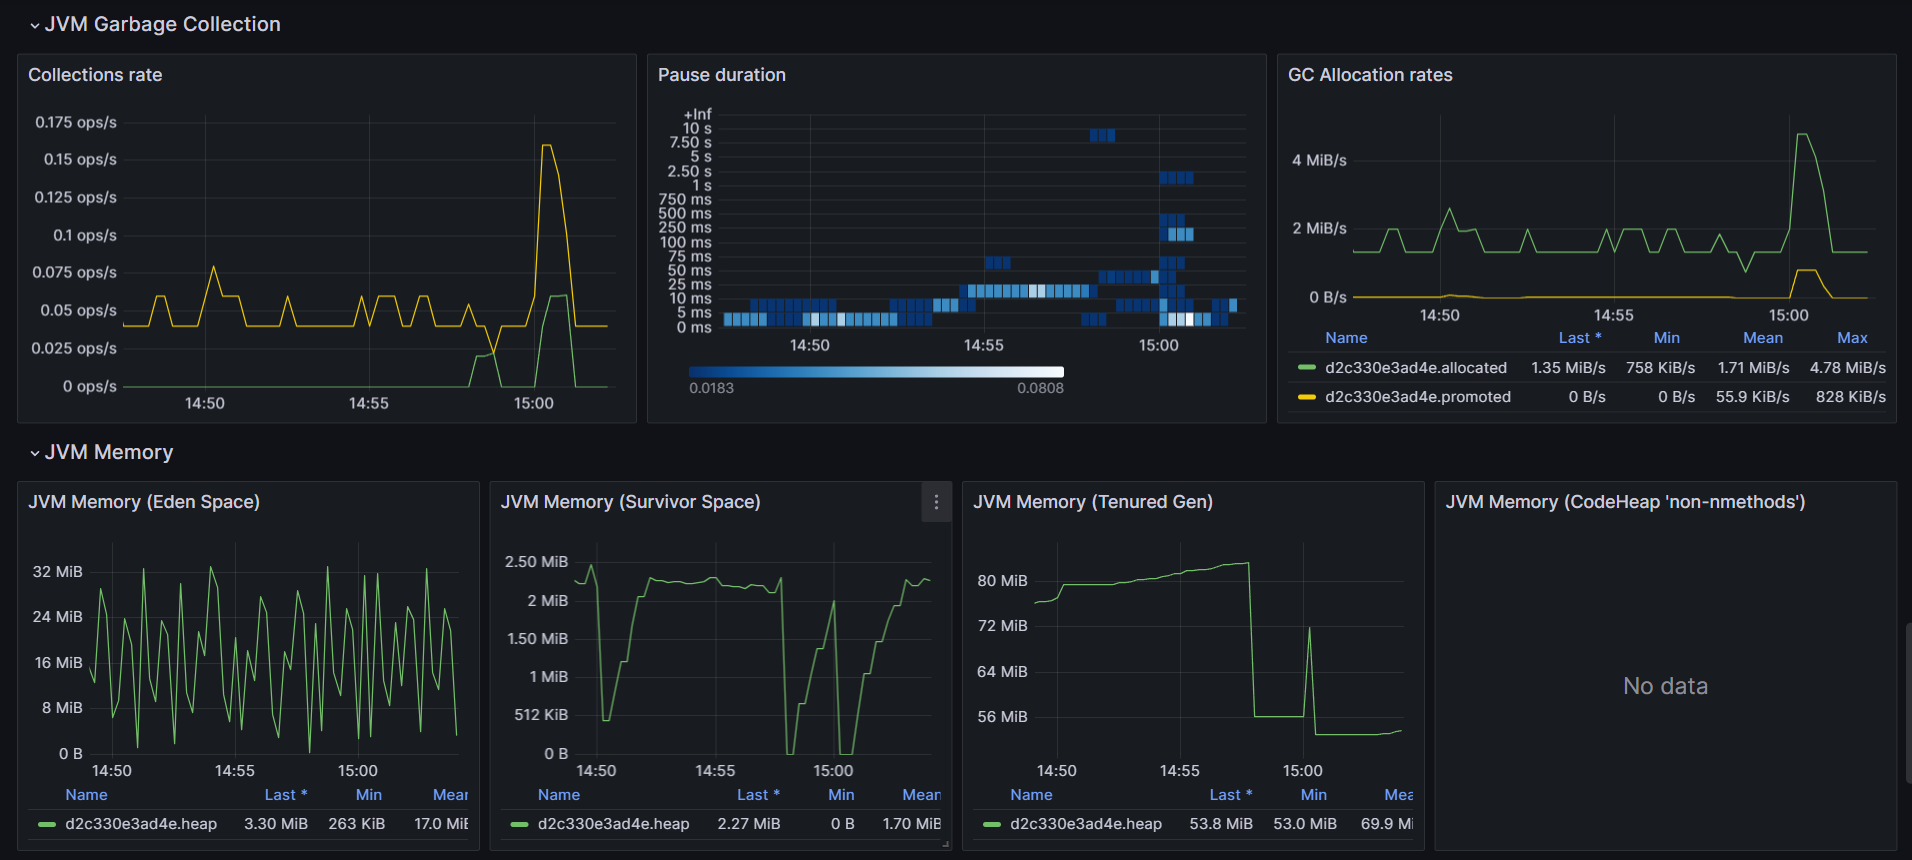
OpenTelemetry JVM Micrometer using RED and USE method
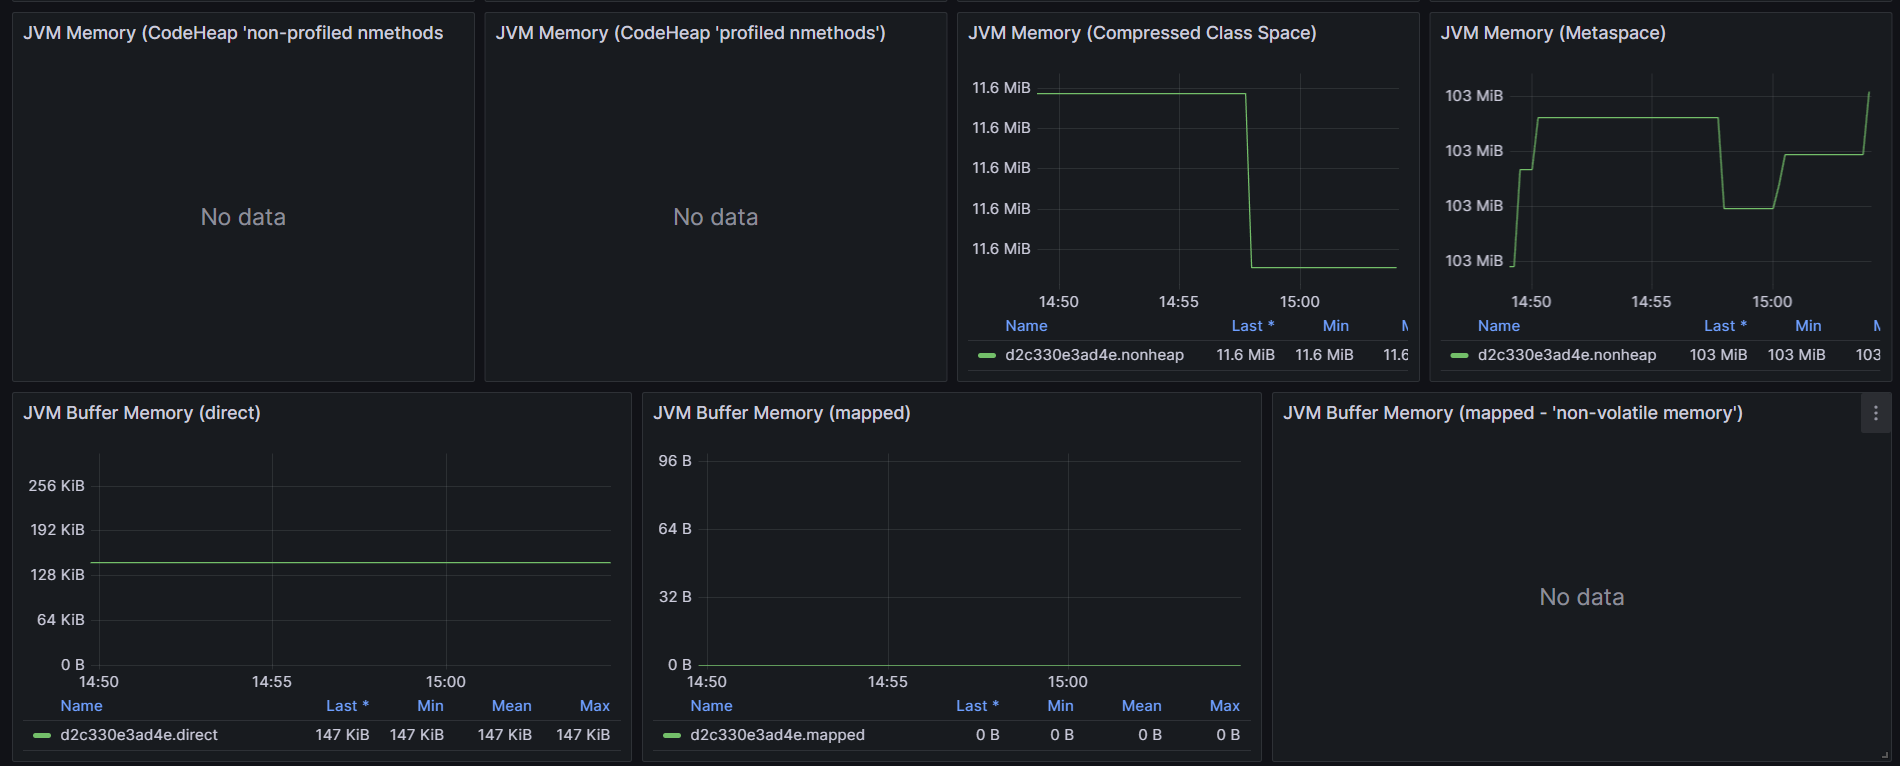
Screenshots
Used Metrics 3535
area
deployment_environment
heap
host_name
http_server_requests_milliseconds_bucket
http_server_requests_milliseconds_count
id
jvm_buffer_memory_used_bytes
jvm_classes_loaded
jvm_gc_memory_allocated_bytes_total
jvm_gc_memory_promoted_bytes_total
jvm_gc_pause_milliseconds_bucket
jvm_gc_pause_milliseconds_count
jvm_memory_committed_bytes
jvm_memory_max_bytes
jvm_memory_used_bytes
jvm_threads_daemon
jvm_threads_live
jvm_threads_peak
jvm_threads_states
logback_events_total
nonheap
process_files_max
process_files_open
process_uptime_milliseconds
service_version
status
system_cpu_count
system_cpu_usage
system_load_average_
tomcat_threads_busy
tomcat_threads_config_max
tomcat_threads_current
topk
uri
Get Dashboard✕
Download
Copy to Clipboard