OpenTelemetry dotnet webapi 2,1022,102
Description
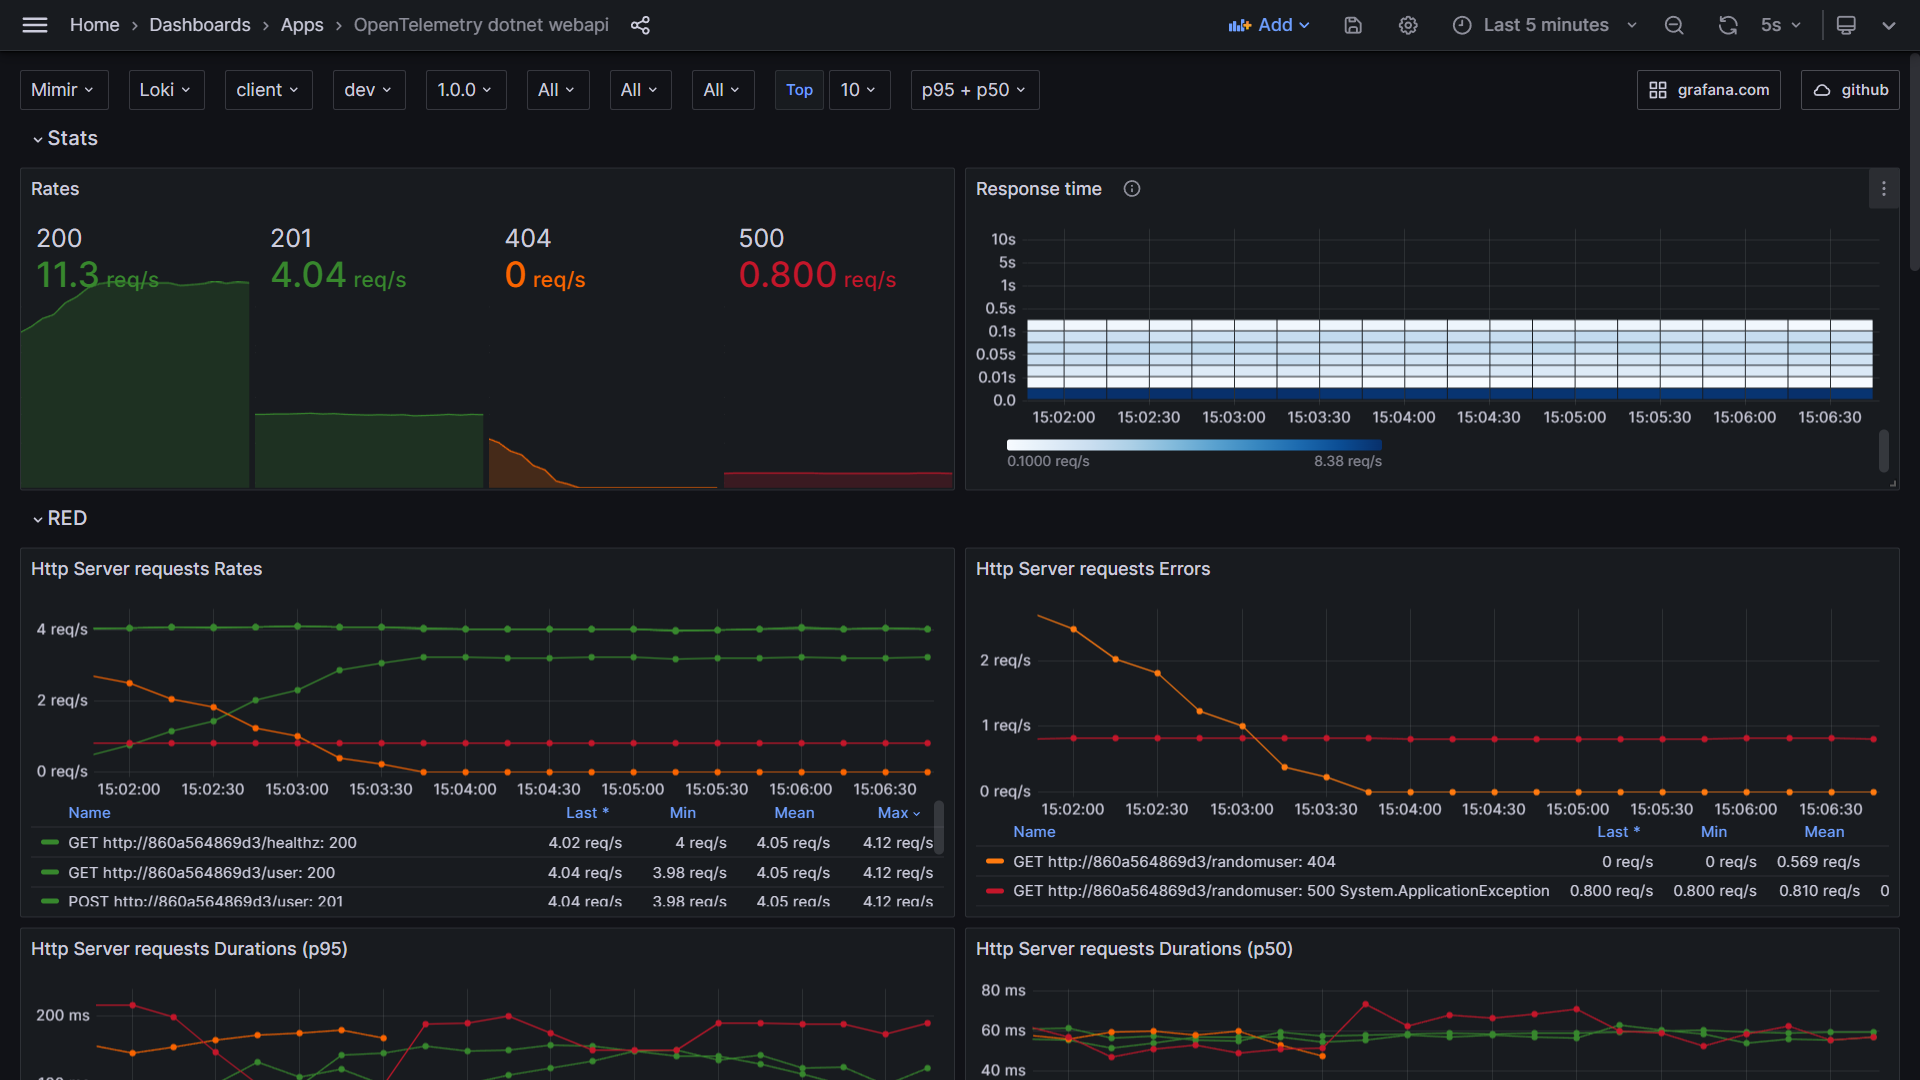
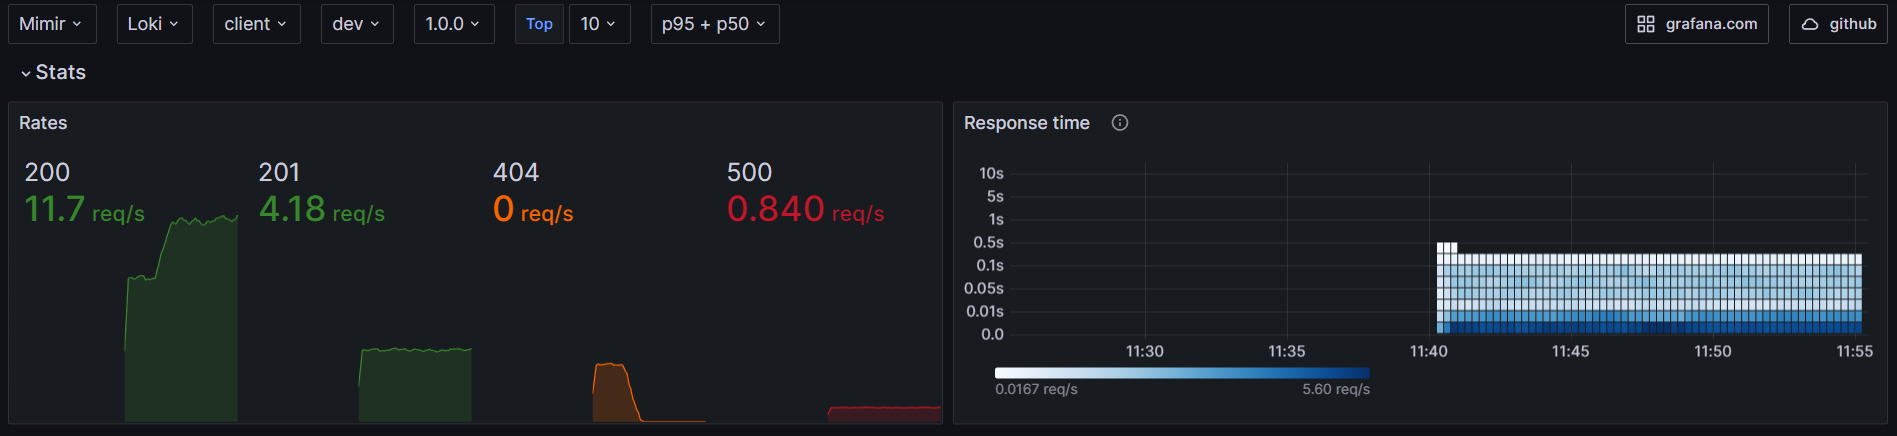
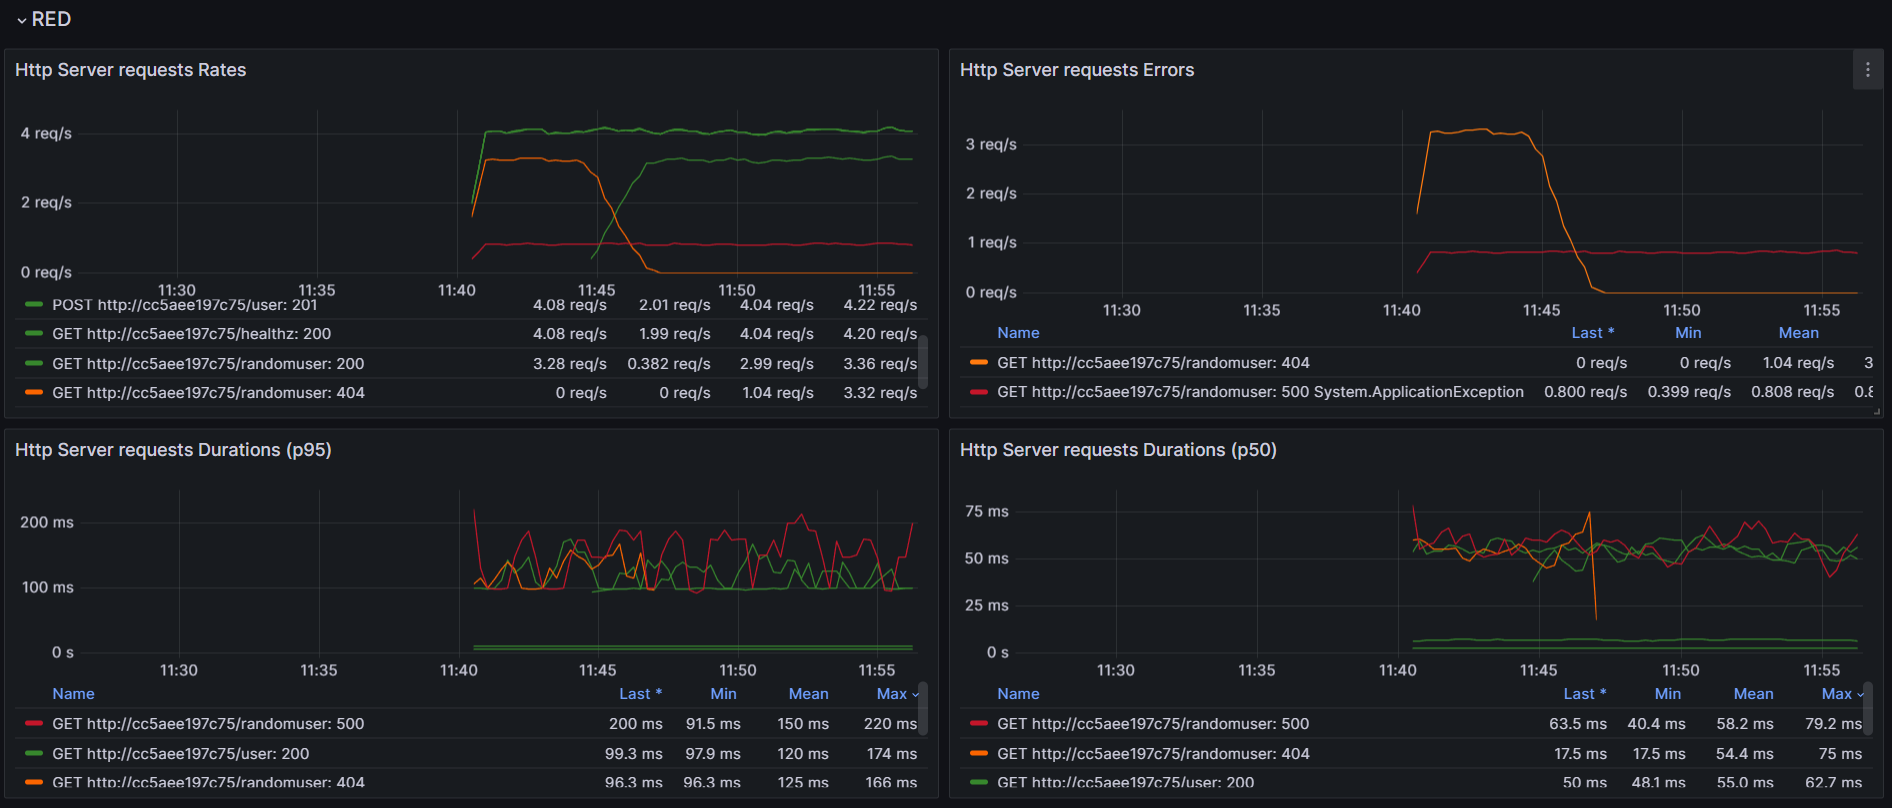
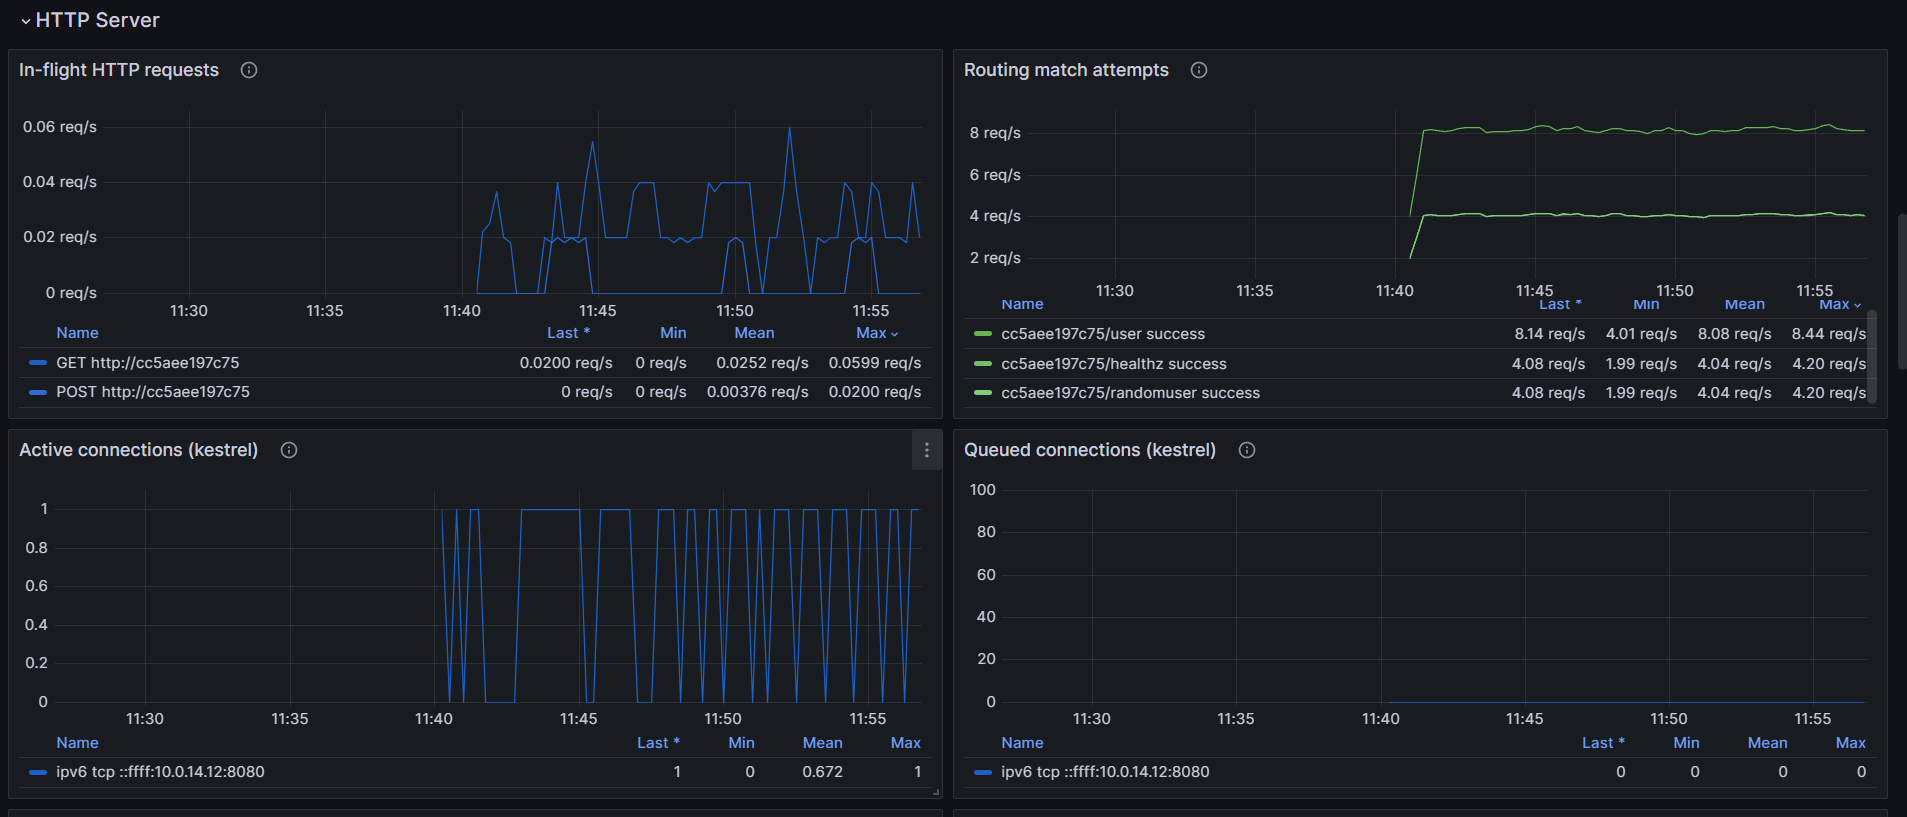
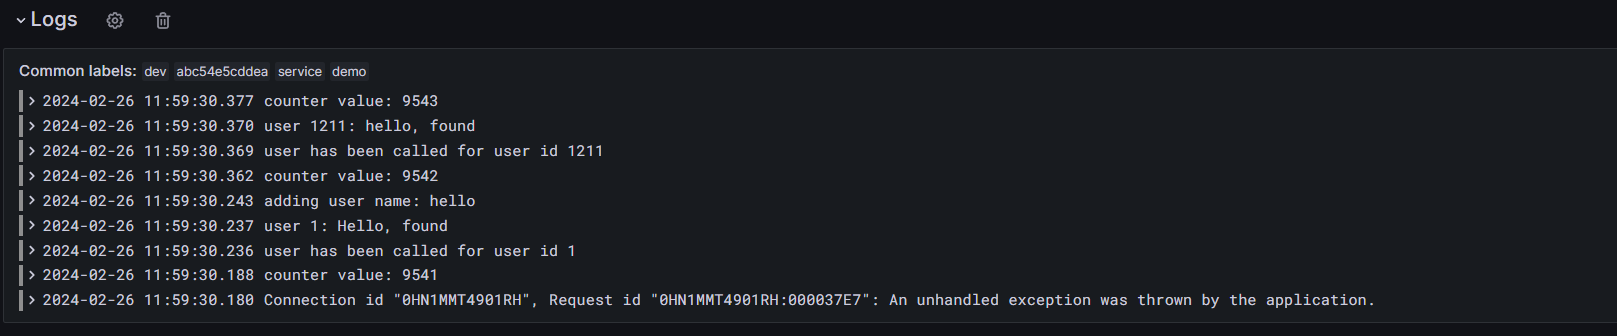
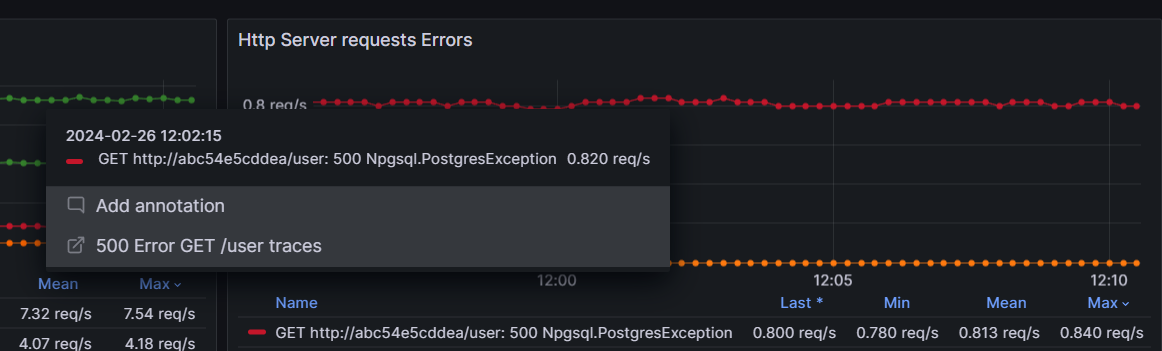
OpenTelemetry .Net (dotnet) ASP.NET using RED and USE method
Screenshots
Used Metrics 2929
aspnetcore_routing_match_attempts
aspnetcore_routing_match_attempts_total
deployment_environment
host_name
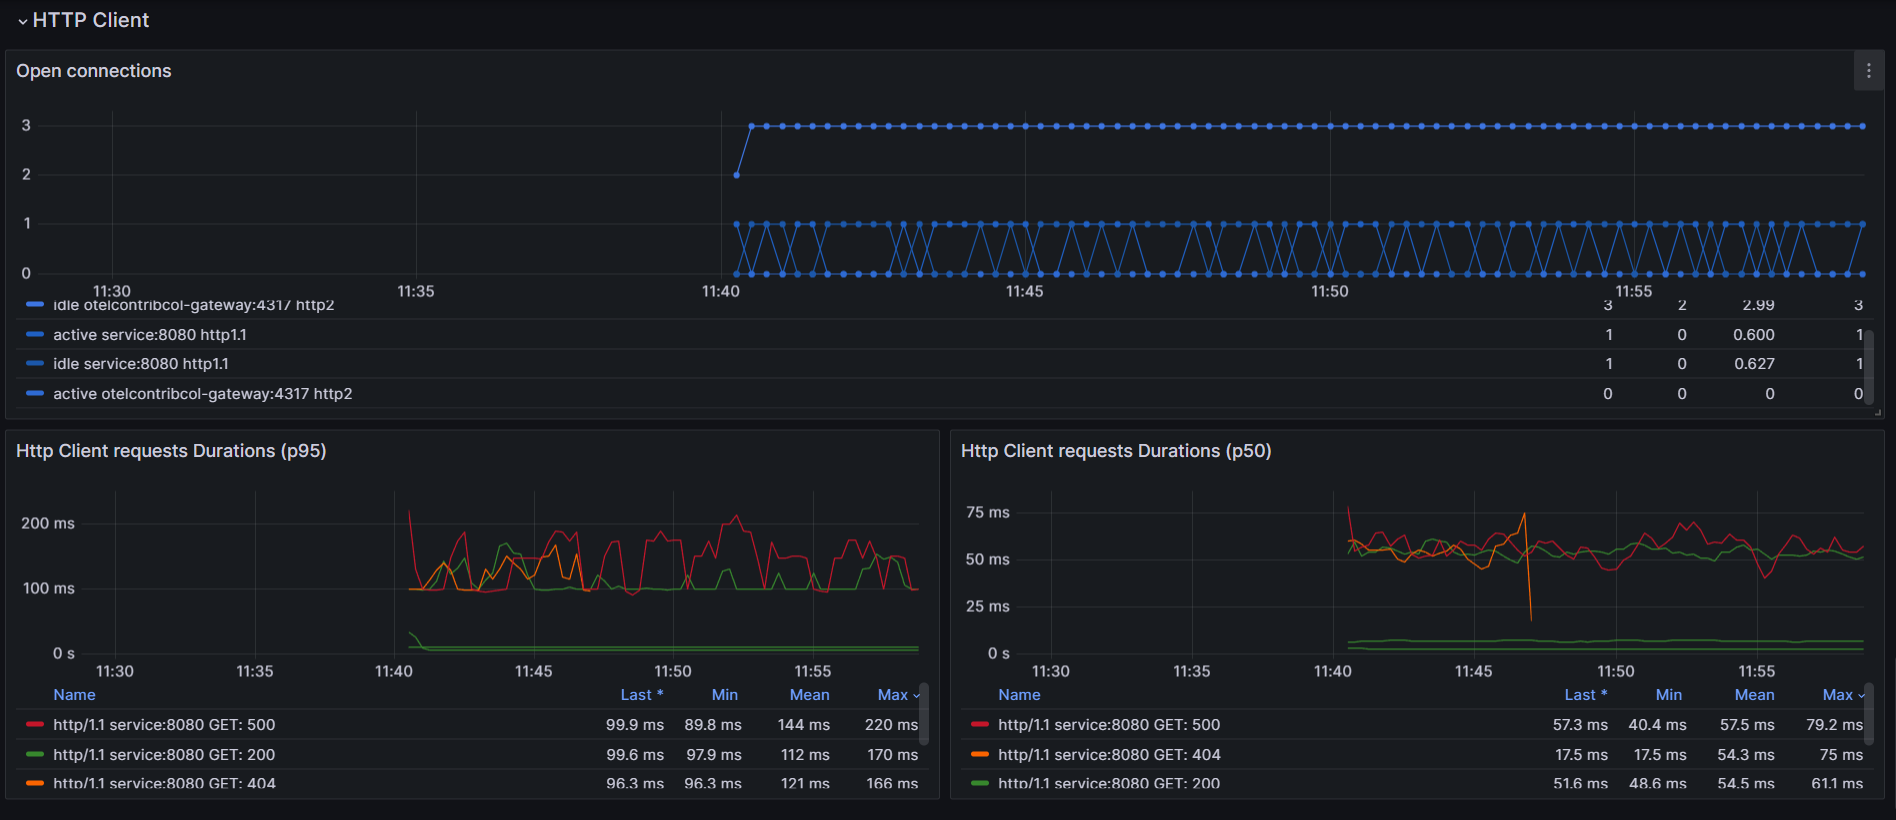
http_client_open_connections
http_client_request_duration_seconds_bucket
http_response_status_code
http_route
http_server_active_requests
http_server_request_duration_seconds_bucket
http_server_request_duration_seconds_count
kestrel_active_connections
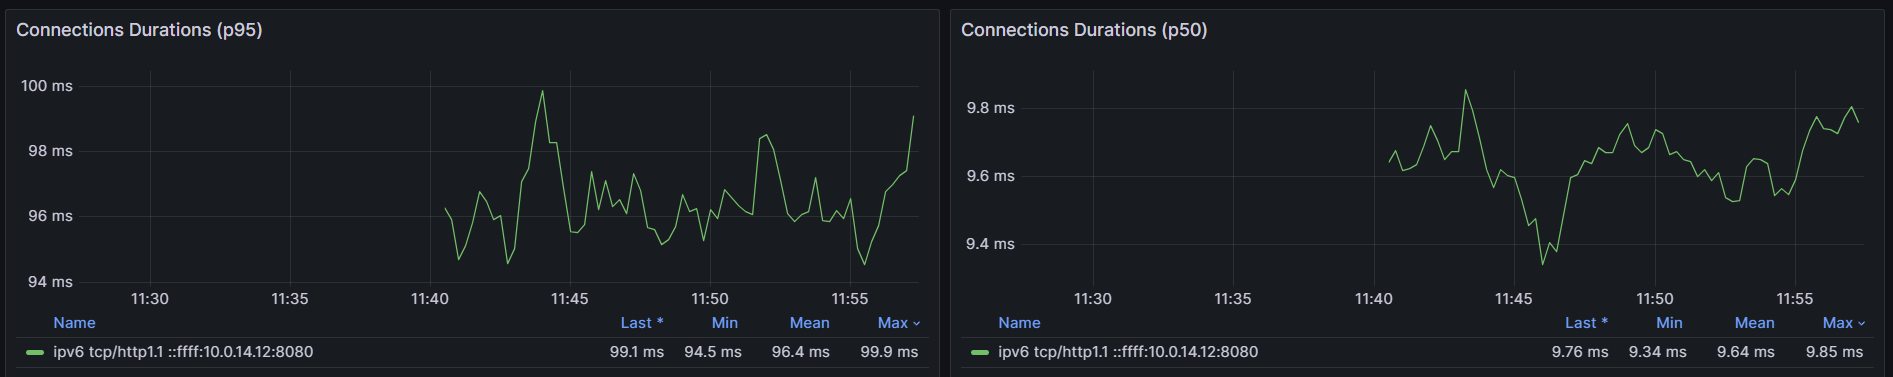
kestrel_connection_duration_seconds_bucket
kestrel_queued_connections
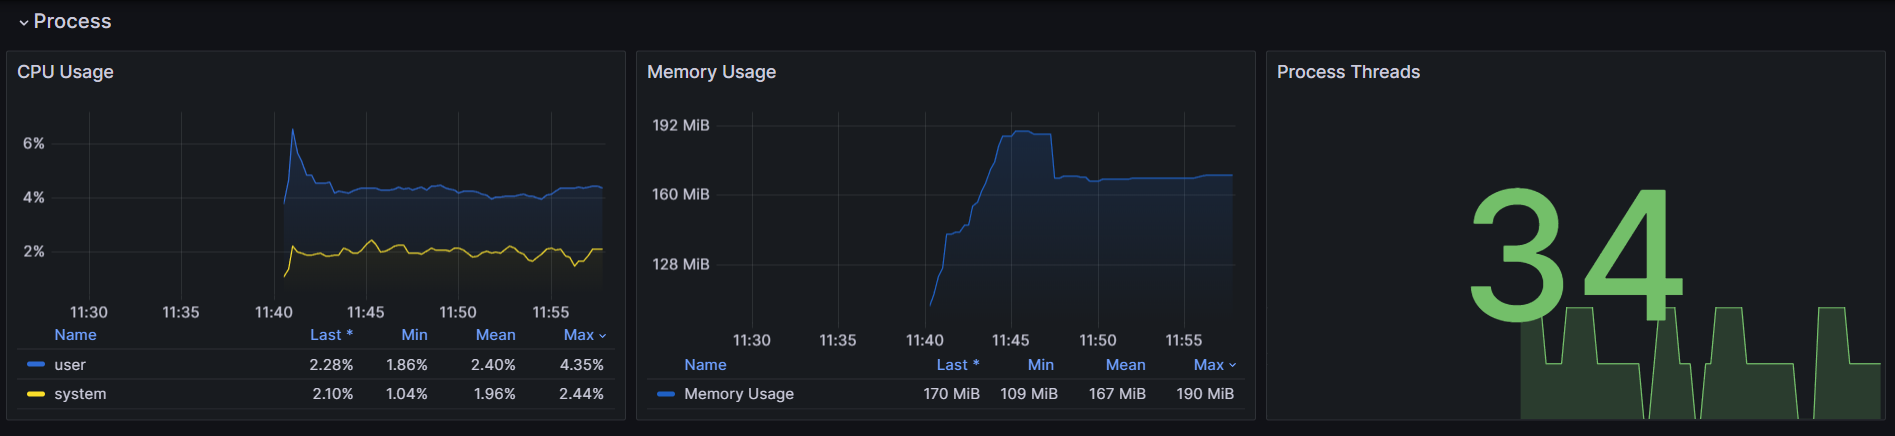
process_cpu_time_seconds_total
process_memory_usage_bytes
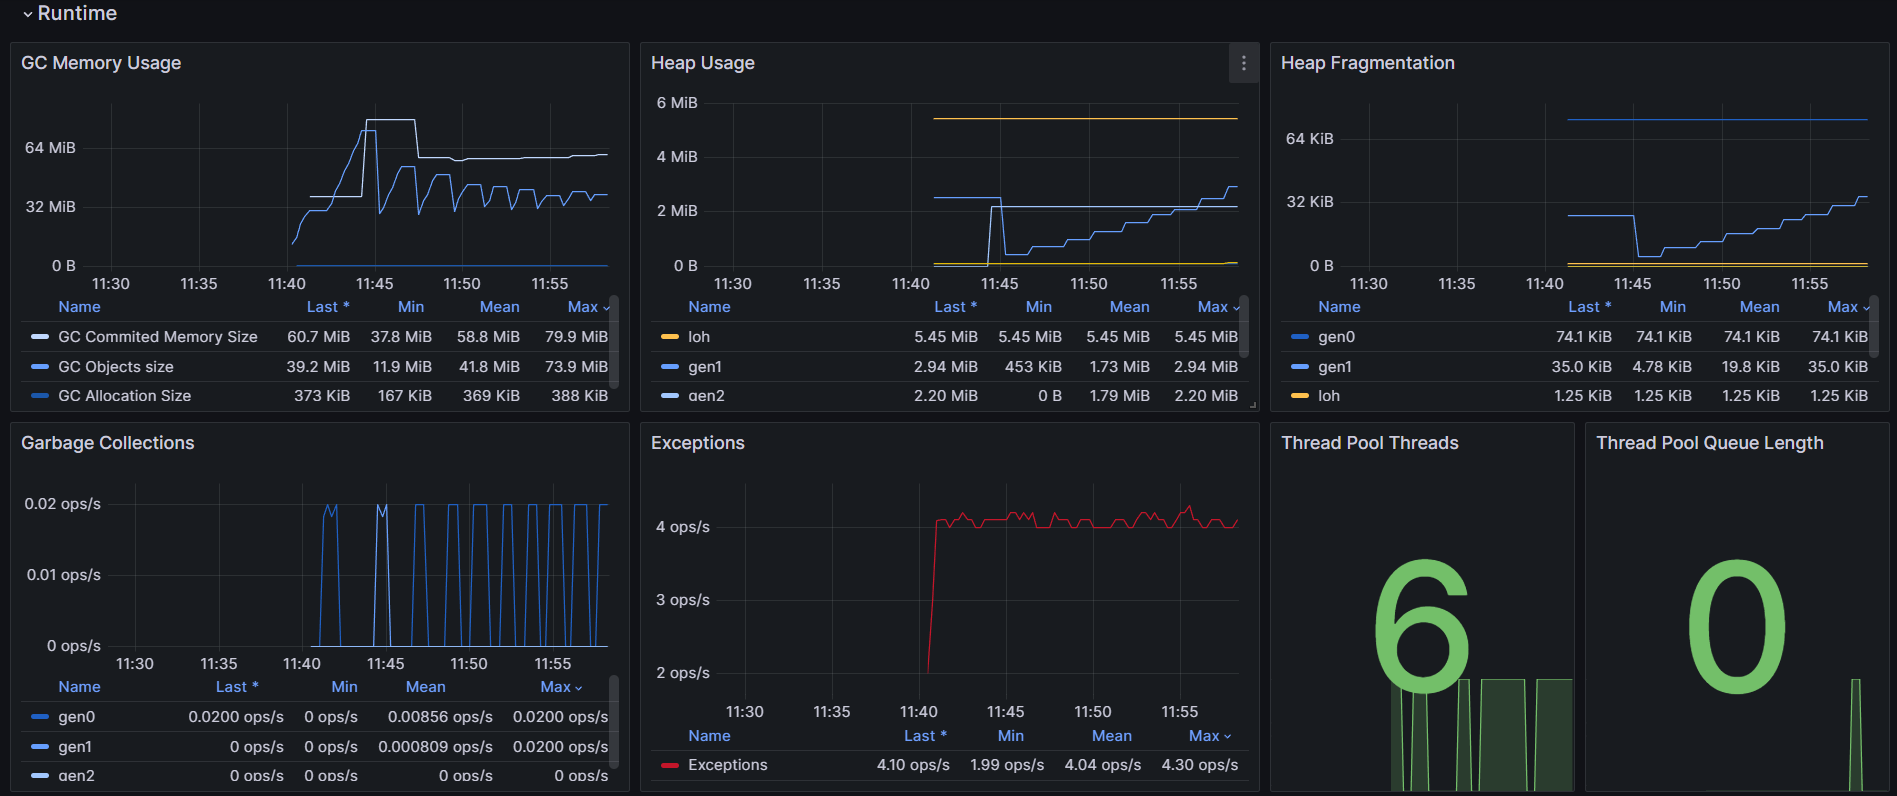
process_runtime_dotnet_exceptions_count_total
process_runtime_dotnet_gc_allocations_size
process_runtime_dotnet_gc_collections_count_total
process_runtime_dotnet_gc_committed_memory_size_bytes
process_runtime_dotnet_gc_heap_fragmentation_size_bytes
process_runtime_dotnet_gc_heap_size_bytes
process_runtime_dotnet_gc_objects_size
process_runtime_dotnet_thread_pool_queue_length
process_runtime_dotnet_thread_pool_threads_count
process_threads
service_version
top
topk