OpenTelemetry Collector HostMetrics (Node Exporter) 2,7092,709
1/29/2024
1/31/2024
6
>=10.3.1
Prometheus
Description
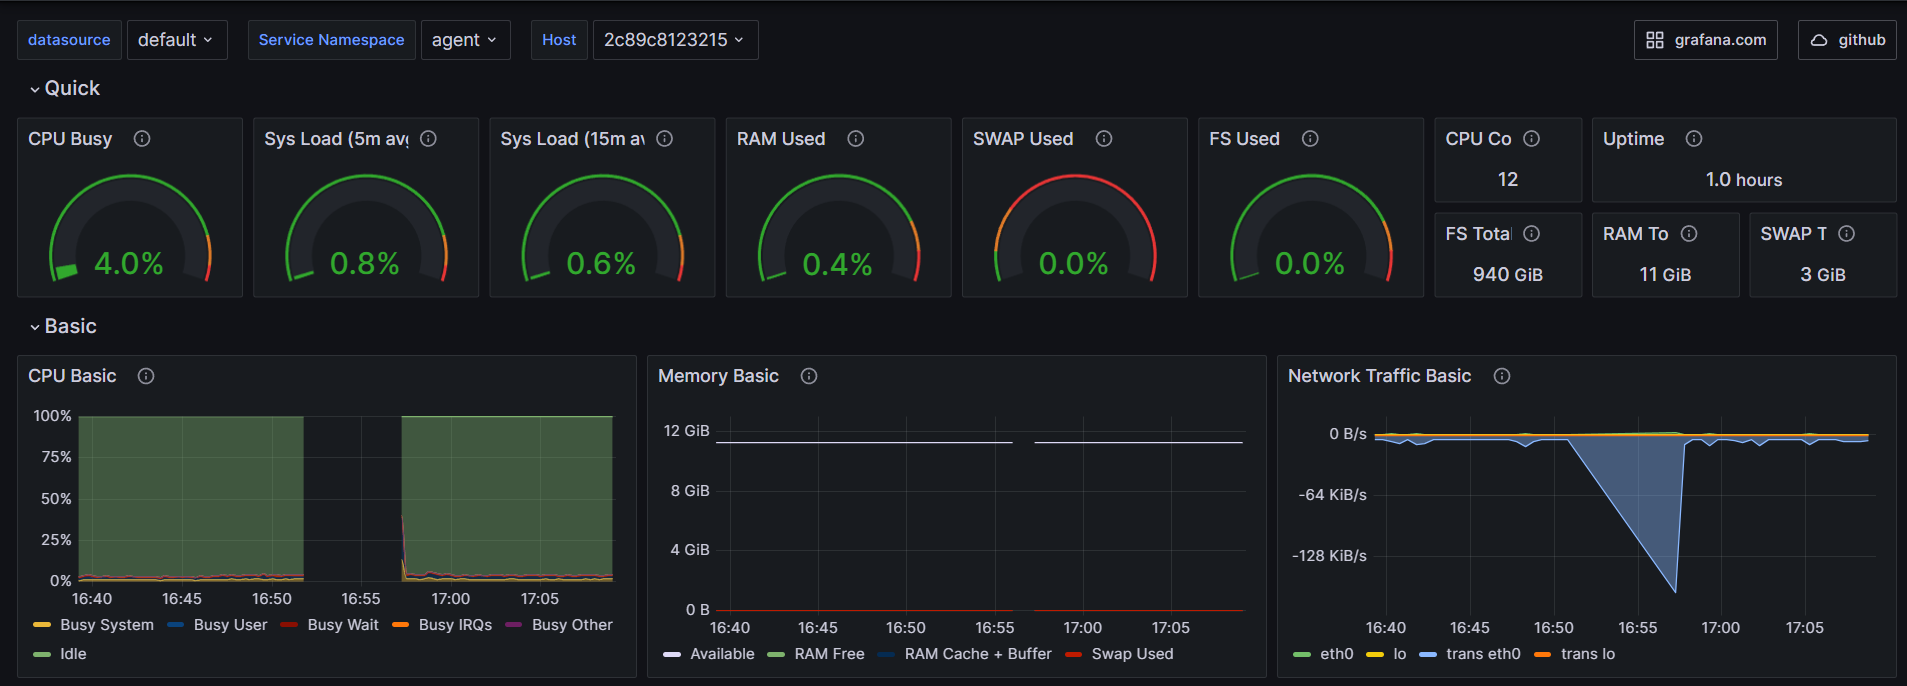
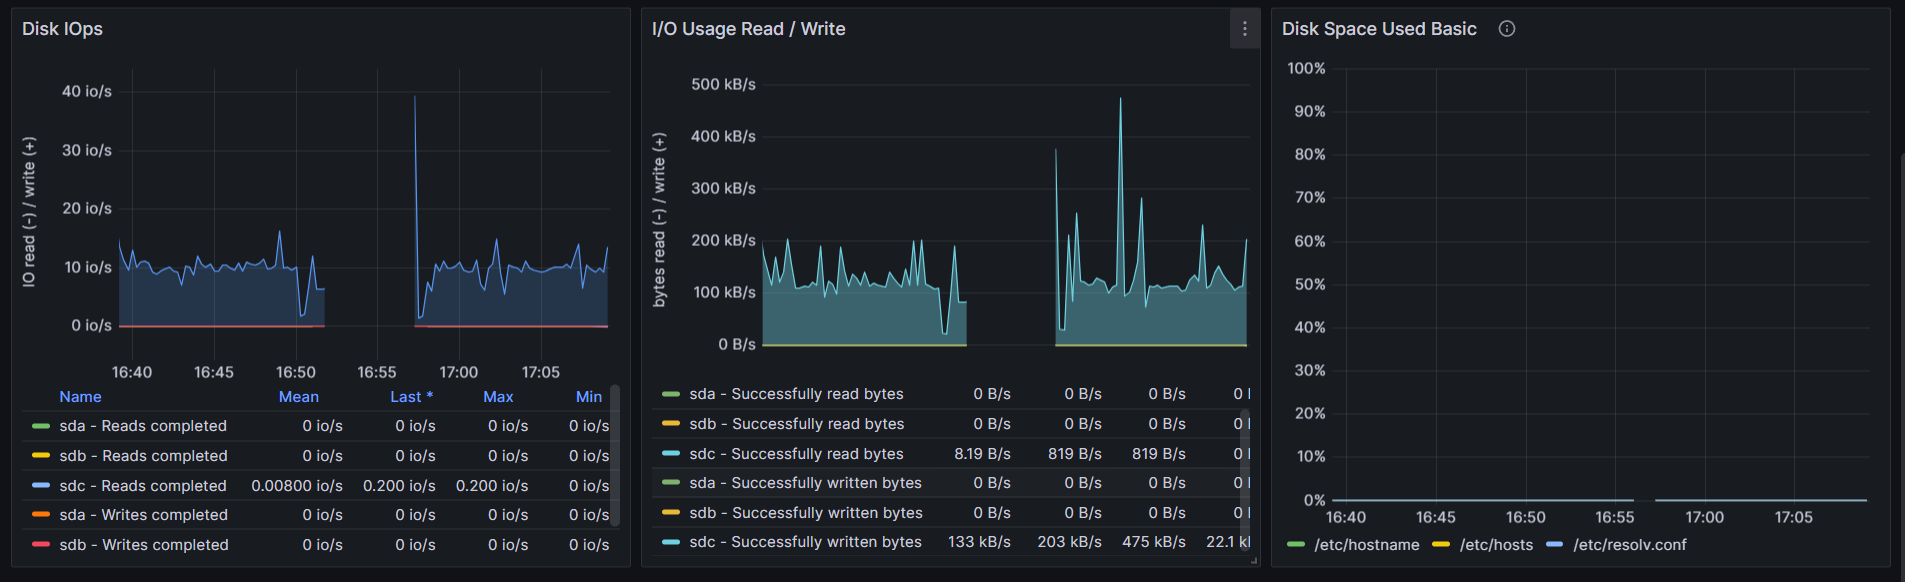
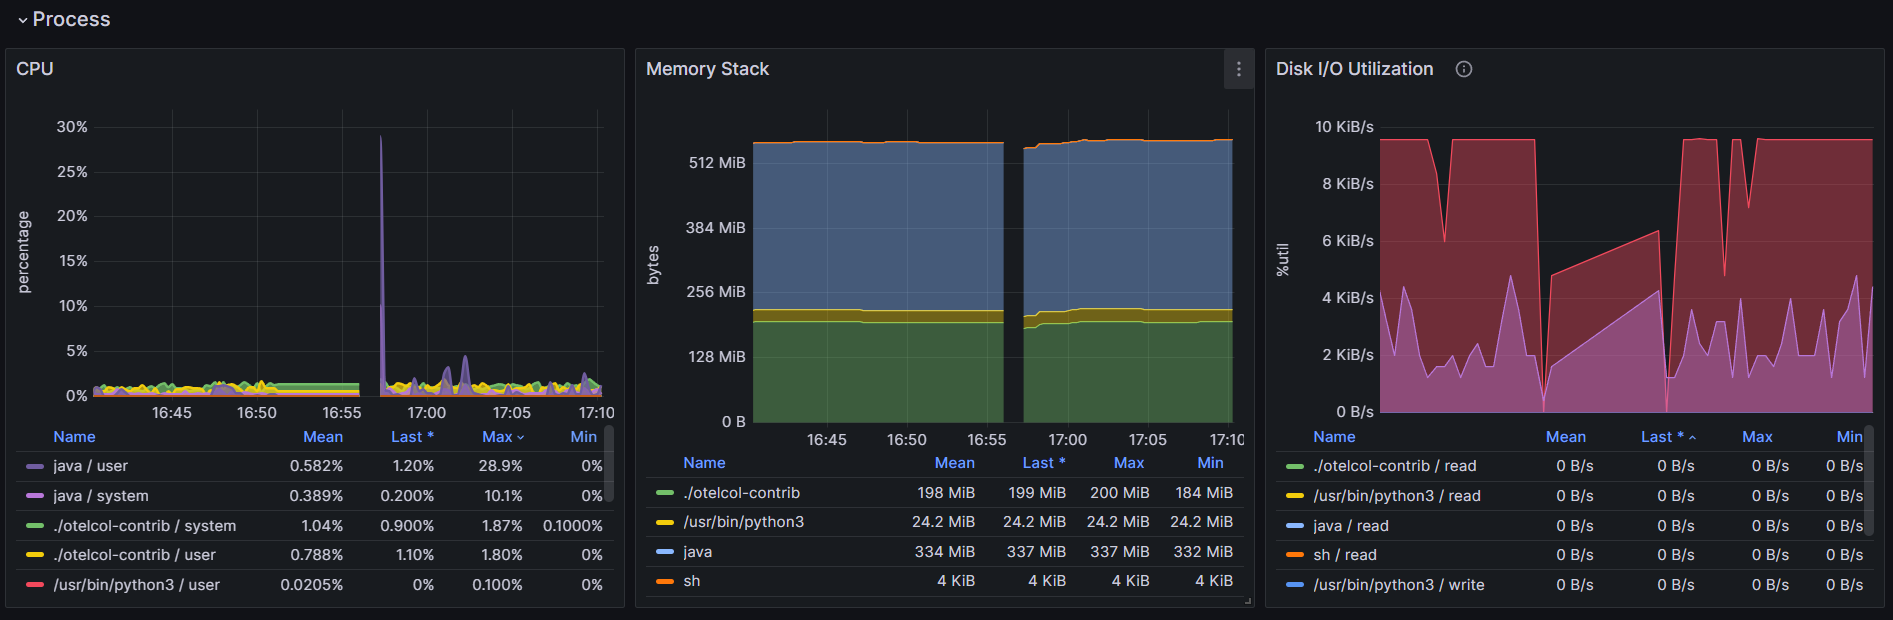
OpenTelemetry Collector otelcol-contrib hostmetrics (Node Exporter)
Screenshots
Used Metrics 3434
buffered
cached
device
direction
free
idle
irq
otelcol_process_uptime
process_cpu_utilization
process_disk_io
process_memory_usage
read
receive
rootfs
service_namespace
state
system
system_cpu_load_average_
system_cpu_logical_count
system_cpu_time
system_disk_io
system_disk_operations
system_filesystem_usage
system_filesystem_utilization
system_memory_limit
system_memory_usage
system_memory_utilization
system_network_io
system_paging_usage
transmit
used
user
wait
write
Get Dashboard✕
Download
Copy to Clipboard