OpenTelemetry Collector 2,394,1262,394,126
Description
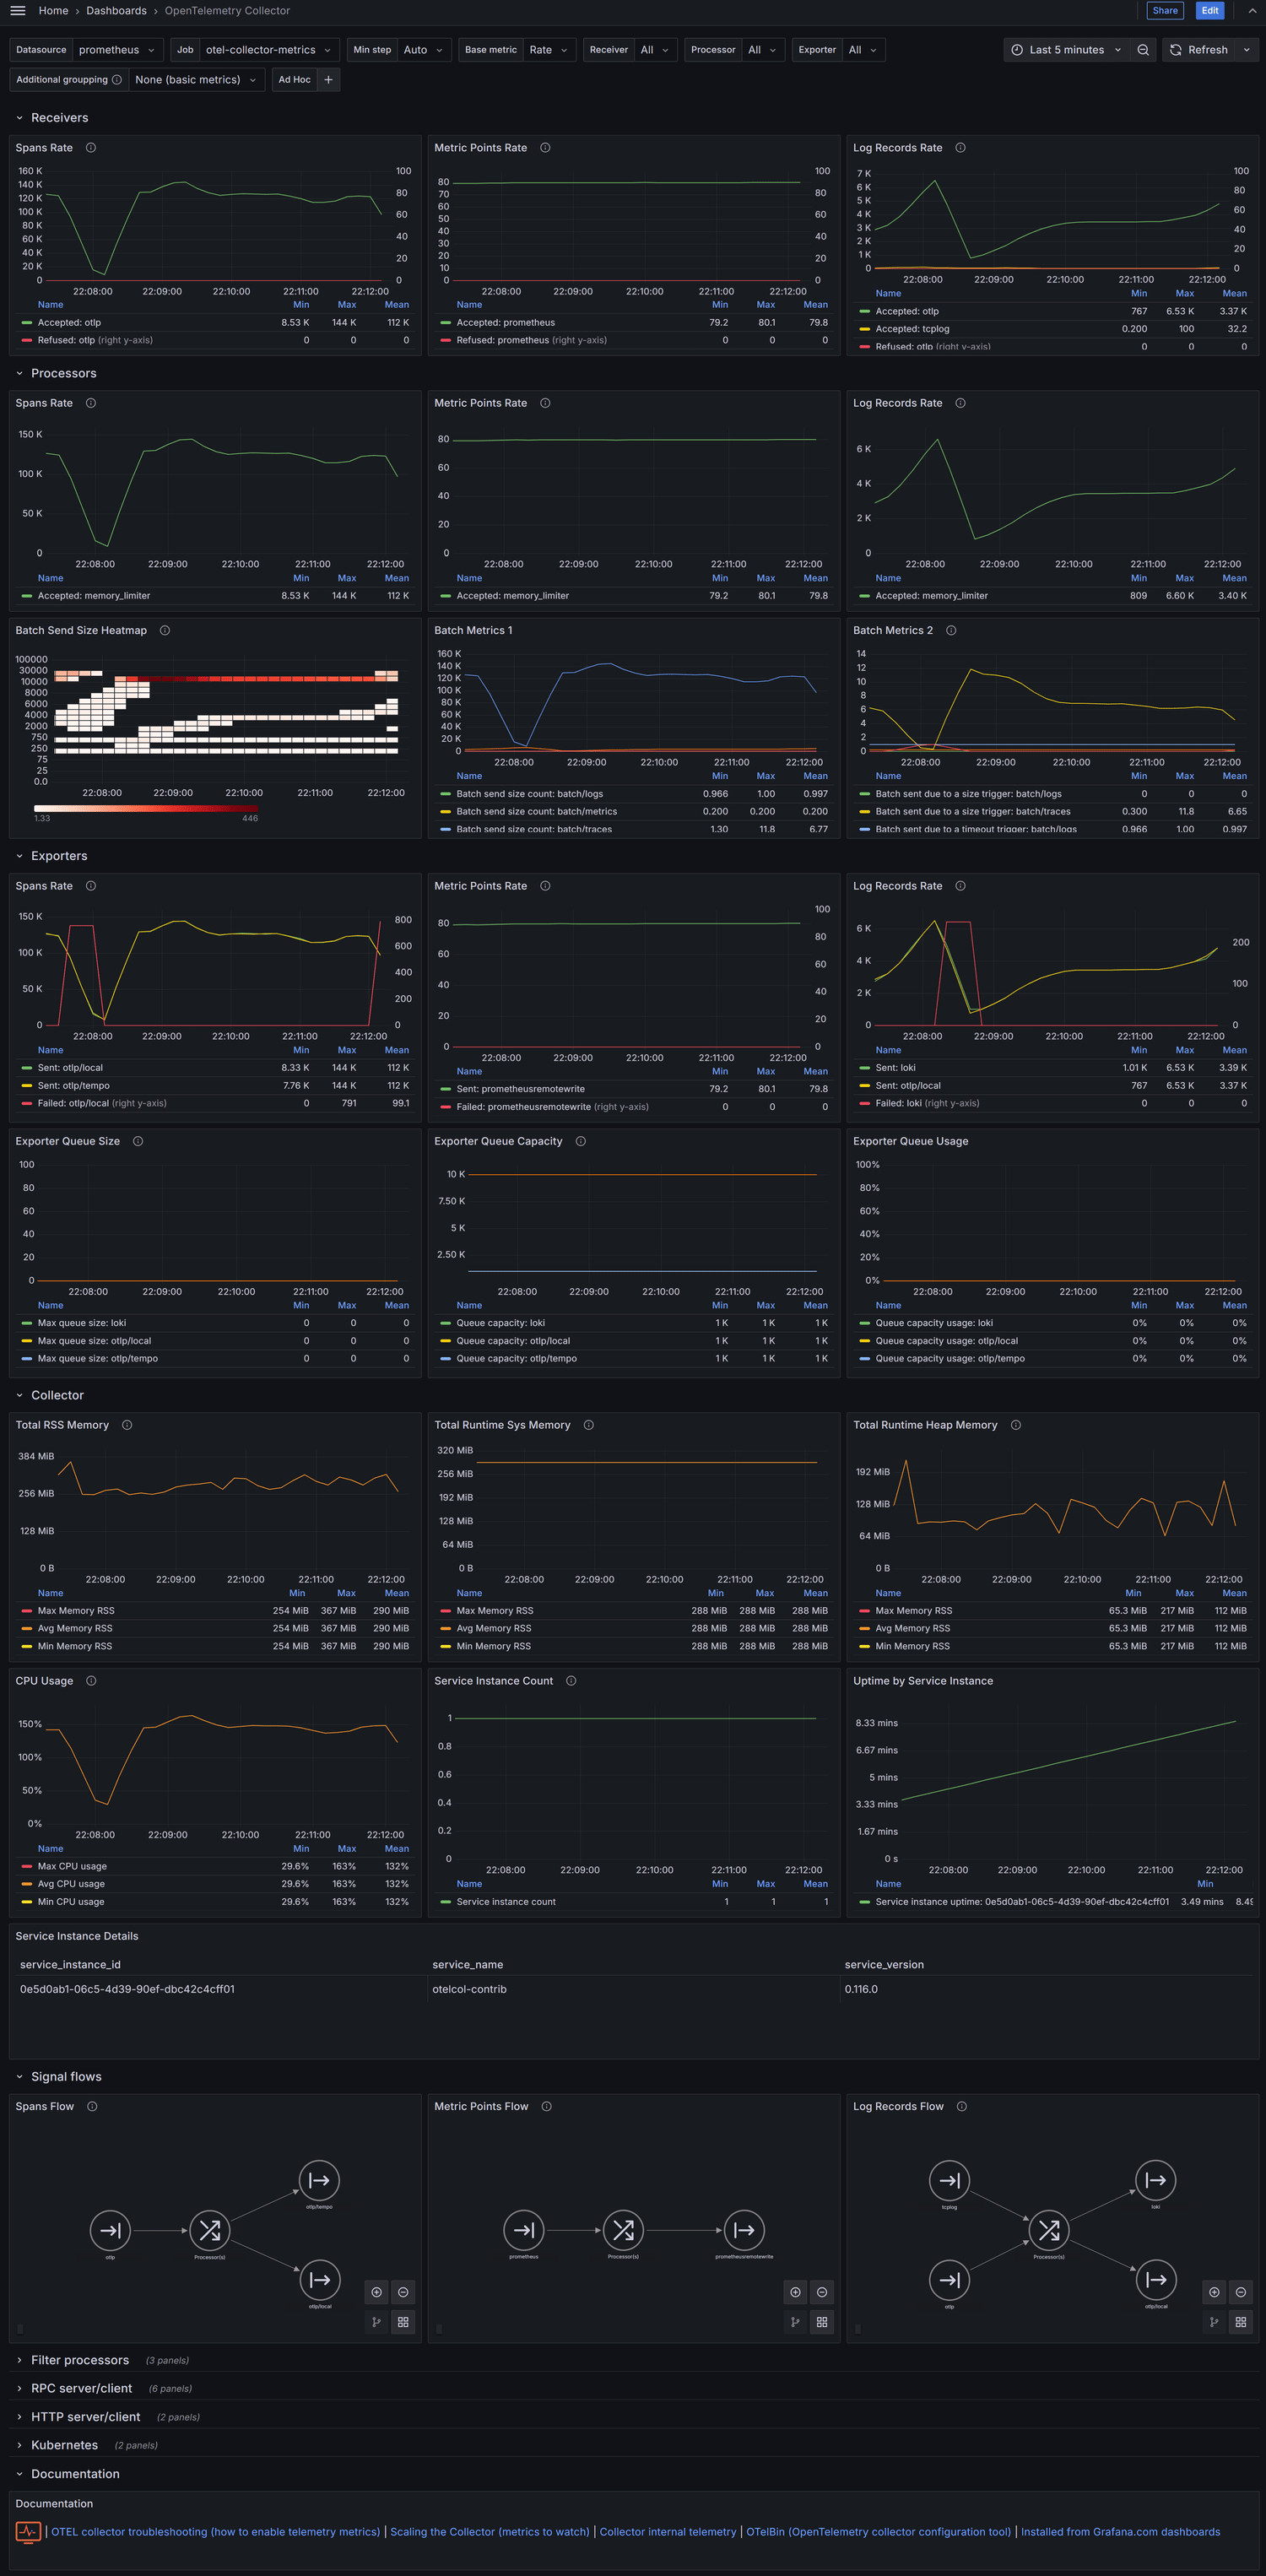
This dashboard monitors OpenTelemetry Collector performance across reception, processing, and export stages, with a focus on traffic, throughput, and resource usage. It surfaces per-metric visibility for spans, metric points, and log records, including accepted vs. refused items, batch processing characteristics, and exporter queue dynamics. Key metrics include otelcol_receiver_accepted_spans / otelcol_receiver_refused_spans, otelcol_processor_incoming_items, and Exporter Queue Usage alongside memory and runtime indicators like Total RSS Memory and Total Runtime Sys Memory to identify bottlenecks and backpressure. The dashboard also features batch-related visuals (e.g., Batch Send Size Heatmap, Batch Metrics 1, Batch Metrics 2) to diagnose throughput and batching efficiency, and Queue Capacity vs Queue Size for exporters to assess queuing pressure.
Screenshots
Used Metrics 6868
Processor
arrow
dummy
edg
exporter
exporters
from
icon
id
instance
job
logs
metrics
otelcol_exporter_enqueue_failed_log_records
otelcol_exporter_enqueue_failed_metric_points
otelcol_exporter_enqueue_failed_spans
otelcol_exporter_queue_capacity
otelcol_exporter_queue_size
otelcol_exporter_send_failed_log_records
otelcol_exporter_send_failed_metric_points
otelcol_exporter_send_failed_spans
otelcol_exporter_sent_log_records
otelcol_exporter_sent_metric_points
otelcol_exporter_sent_spans
otelcol_process_cpu_seconds
otelcol_process_memory_rss
otelcol_process_runtime_heap_alloc_bytes
otelcol_process_runtime_total_sys_memory_bytes
otelcol_process_uptime
otelcol_processor_accepted_log_records
otelcol_processor_accepted_metric_points
otelcol_processor_accepted_spans
otelcol_processor_batch_batch_send_size_bucket
otelcol_processor_batch_batch_send_size_count
otelcol_processor_batch_batch_send_size_sum
otelcol_processor_batch_batch_size_trigger_send
otelcol_processor_batch_timeout_trigger_send
otelcol_processor_dropped_log_records
otelcol_processor_dropped_metric_points
otelcol_processor_dropped_spans
otelcol_processor_incoming_items
otelcol_processor_outgoing_items
otelcol_processor_refused_log_records
otelcol_processor_refused_metric_points
otelcol_processor_refused_spans
otelcol_receiver_accepted_log_records
otelcol_receiver_accepted_metric_points
otelcol_receiver_accepted_spans
otelcol_receiver_refused_log_records
otelcol_receiver_refused_metric_points
otelcol_receiver_refused_spans
processor
random
rcv
receiver
receivers
right
s
service
signal
source
target
target_info
title
to
traces
transport
version