OpenTelemetry Collector 0.68.0 v20230112 380,351380,351
Description
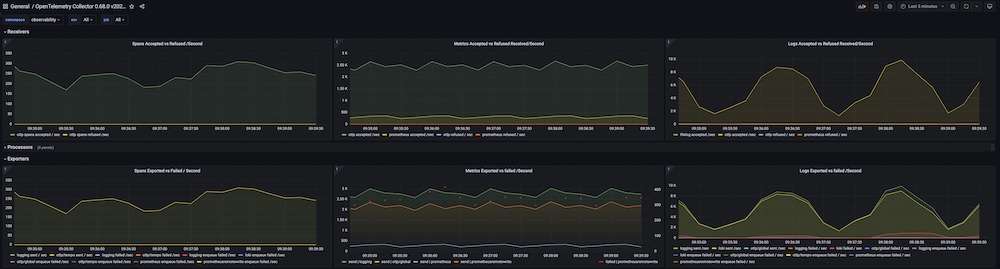
This dashboard tracks the health and throughput of an OpenTelemetry Collector deployment, focusing on accepted versus refused data at both the receiving and exporting stages. It highlights per-second rates for Spans, Metrics, and Logs, alongside queue pressure and failure rates to identify bottlenecks and reliability issues. Key metrics include otelcol_receiver_accepted_spans vs otelcol_receiver_refused_spans, otelcol_exporter_sent_spans vs otelcol_exporter_send_failed_spans, and otelcol_exporter_enqueue_failed_spans, with supporting visuals for CPU and memory usage.
Screenshots
Used Metrics 1919
otelcol_exporter_enqueue_failed_log_records
otelcol_exporter_enqueue_failed_metric_points
otelcol_exporter_enqueue_failed_spans
otelcol_exporter_queue_capacity
otelcol_exporter_queue_size
otelcol_exporter_send_failed_log_records
otelcol_exporter_send_failed_metric_points
otelcol_exporter_send_failed_requests
otelcol_exporter_send_failed_spans
otelcol_exporter_sent_log_records
otelcol_exporter_sent_metric_points
otelcol_exporter_sent_spans
otelcol_process_cpu_seconds
otelcol_process_memory_rss
otelcol_receiver_accepted_log_records
otelcol_receiver_accepted_metric_points
otelcol_receiver_accepted_spans
otelcol_receiver_refused_metric_points
otelcol_receiver_refused_spans