OpenStack overview 1,0341,034
5/16/2024
5/17/2024
3
>=10.1.5
Prometheus
Description
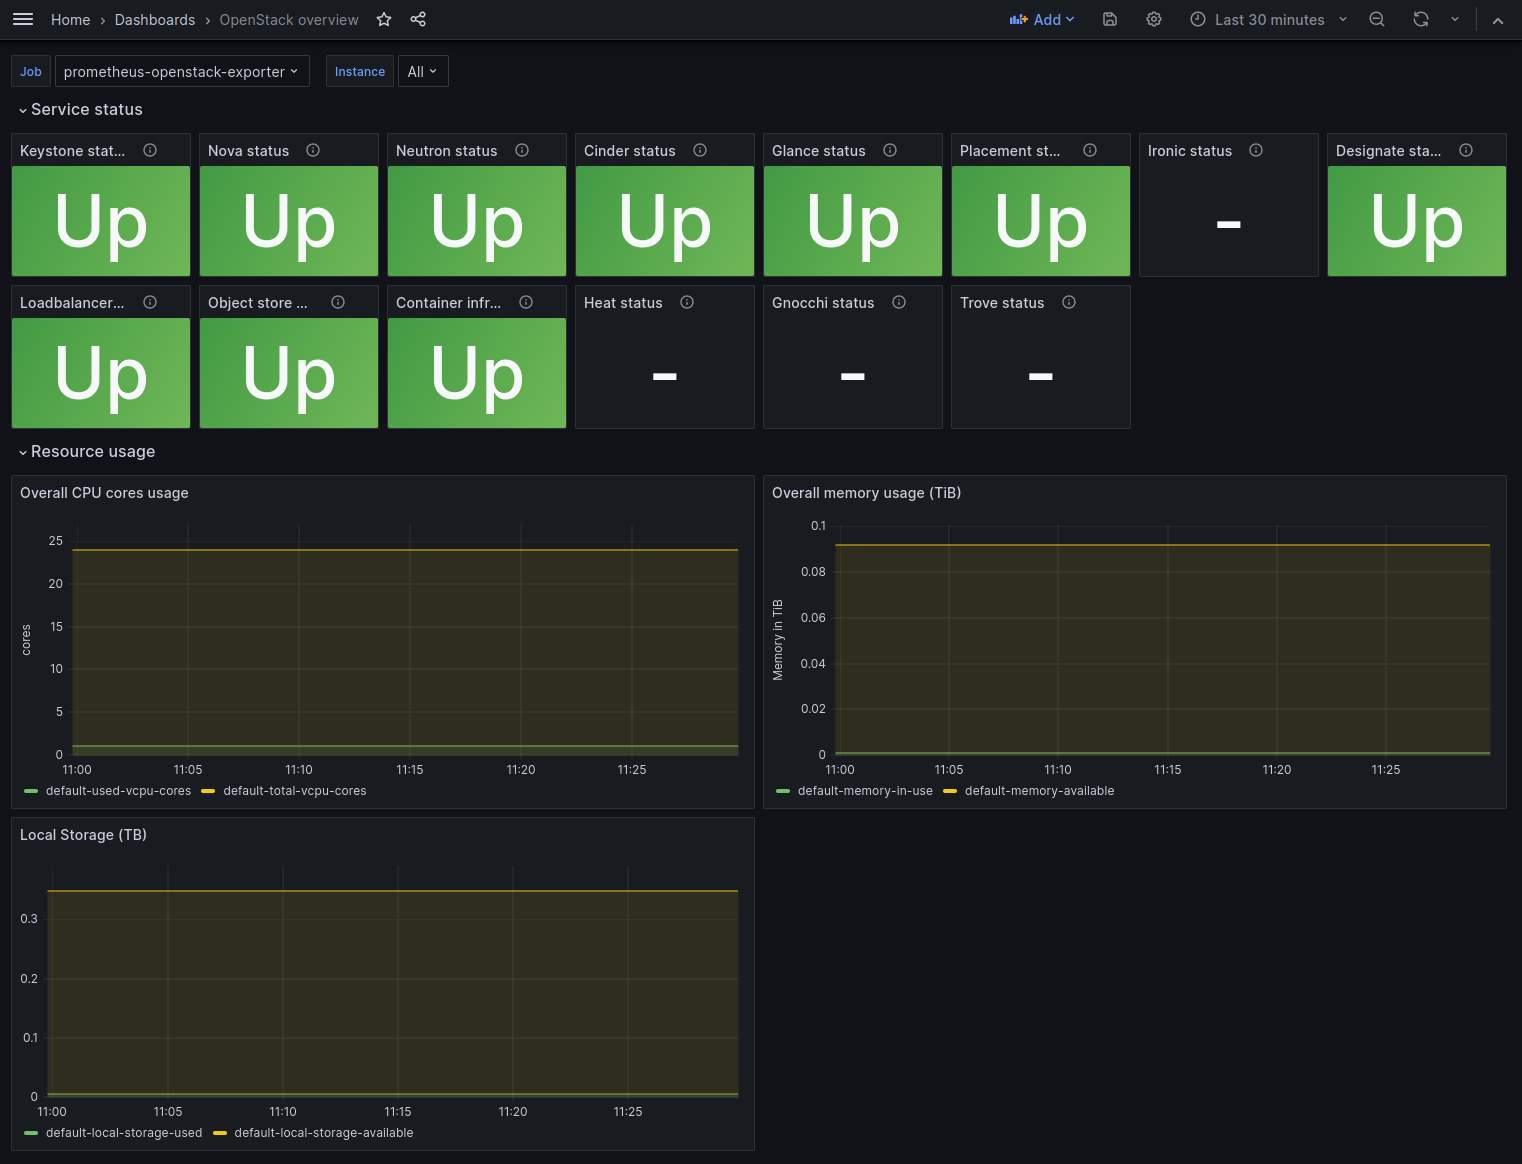
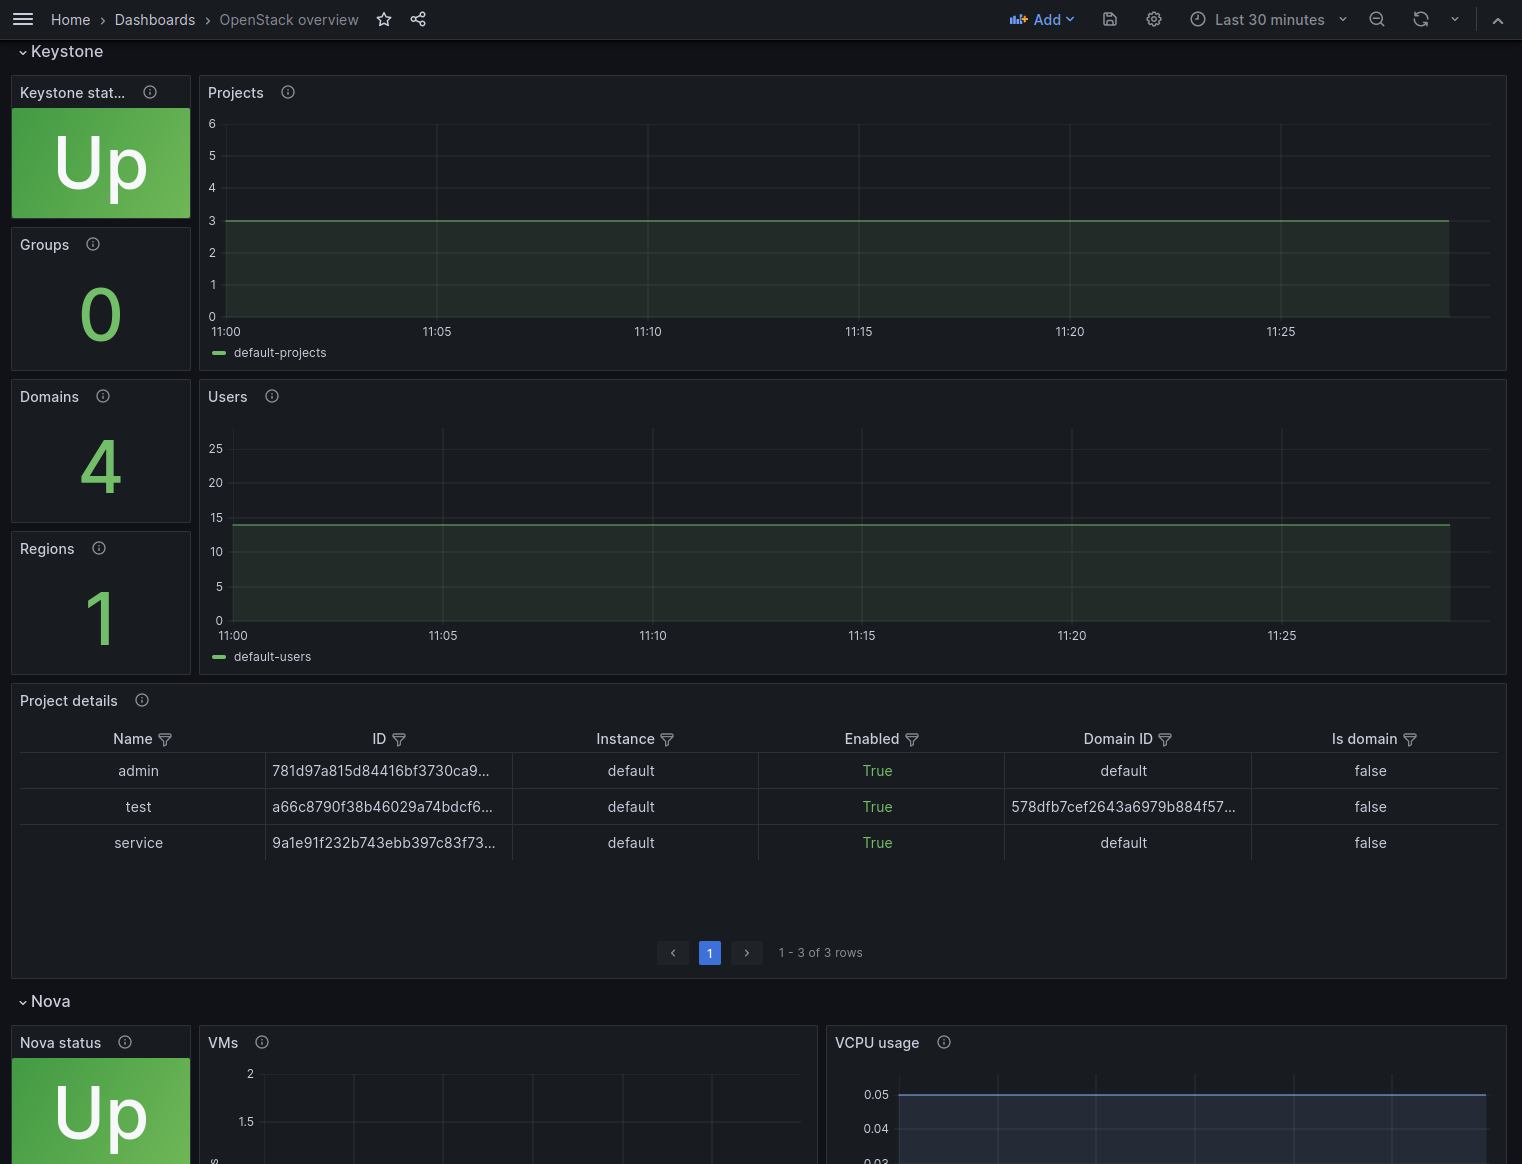
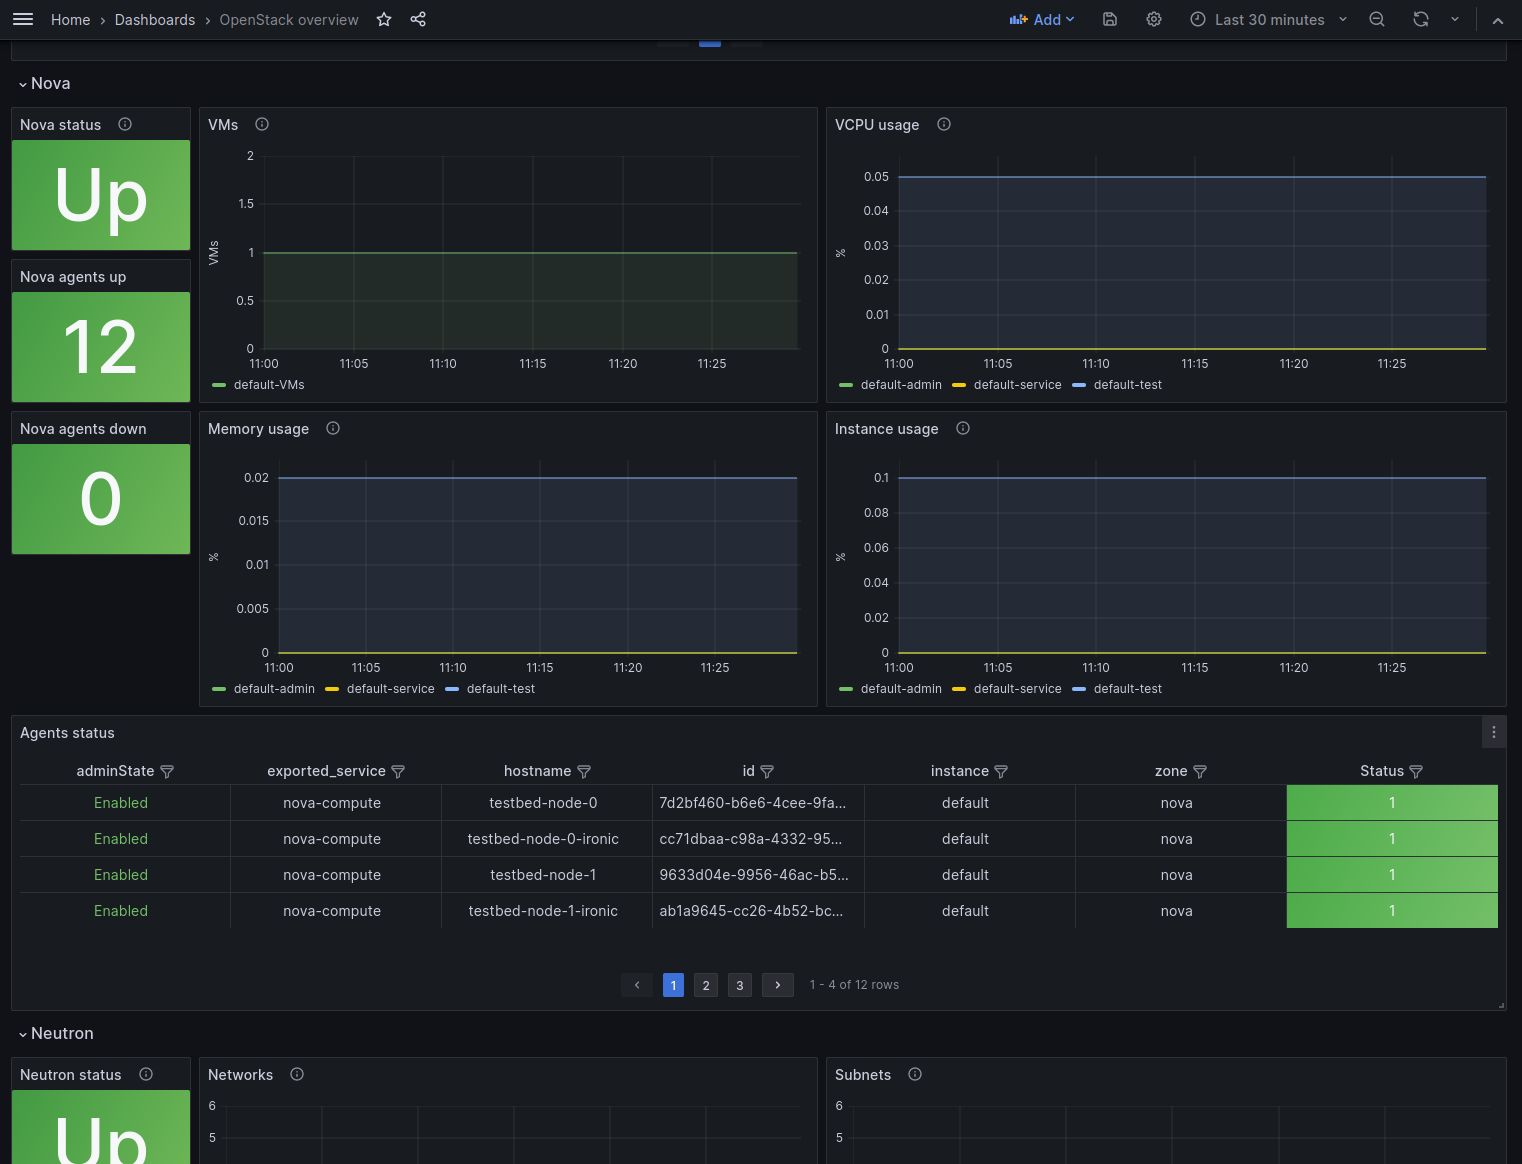
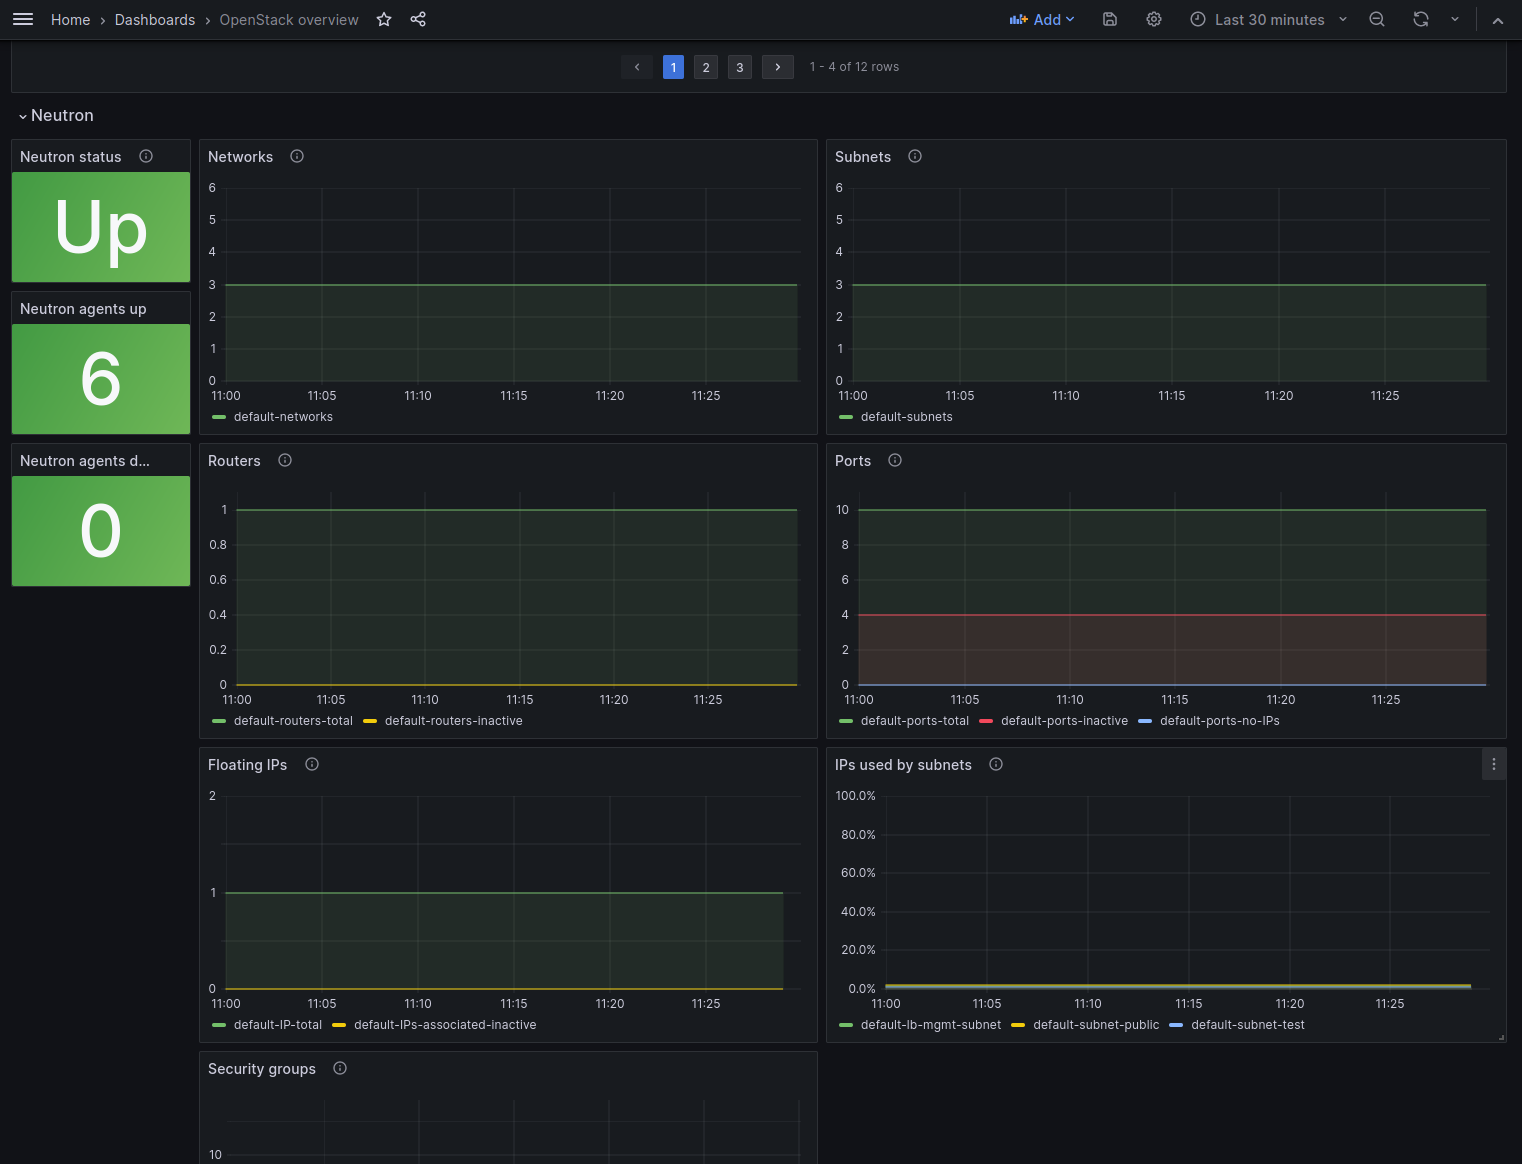
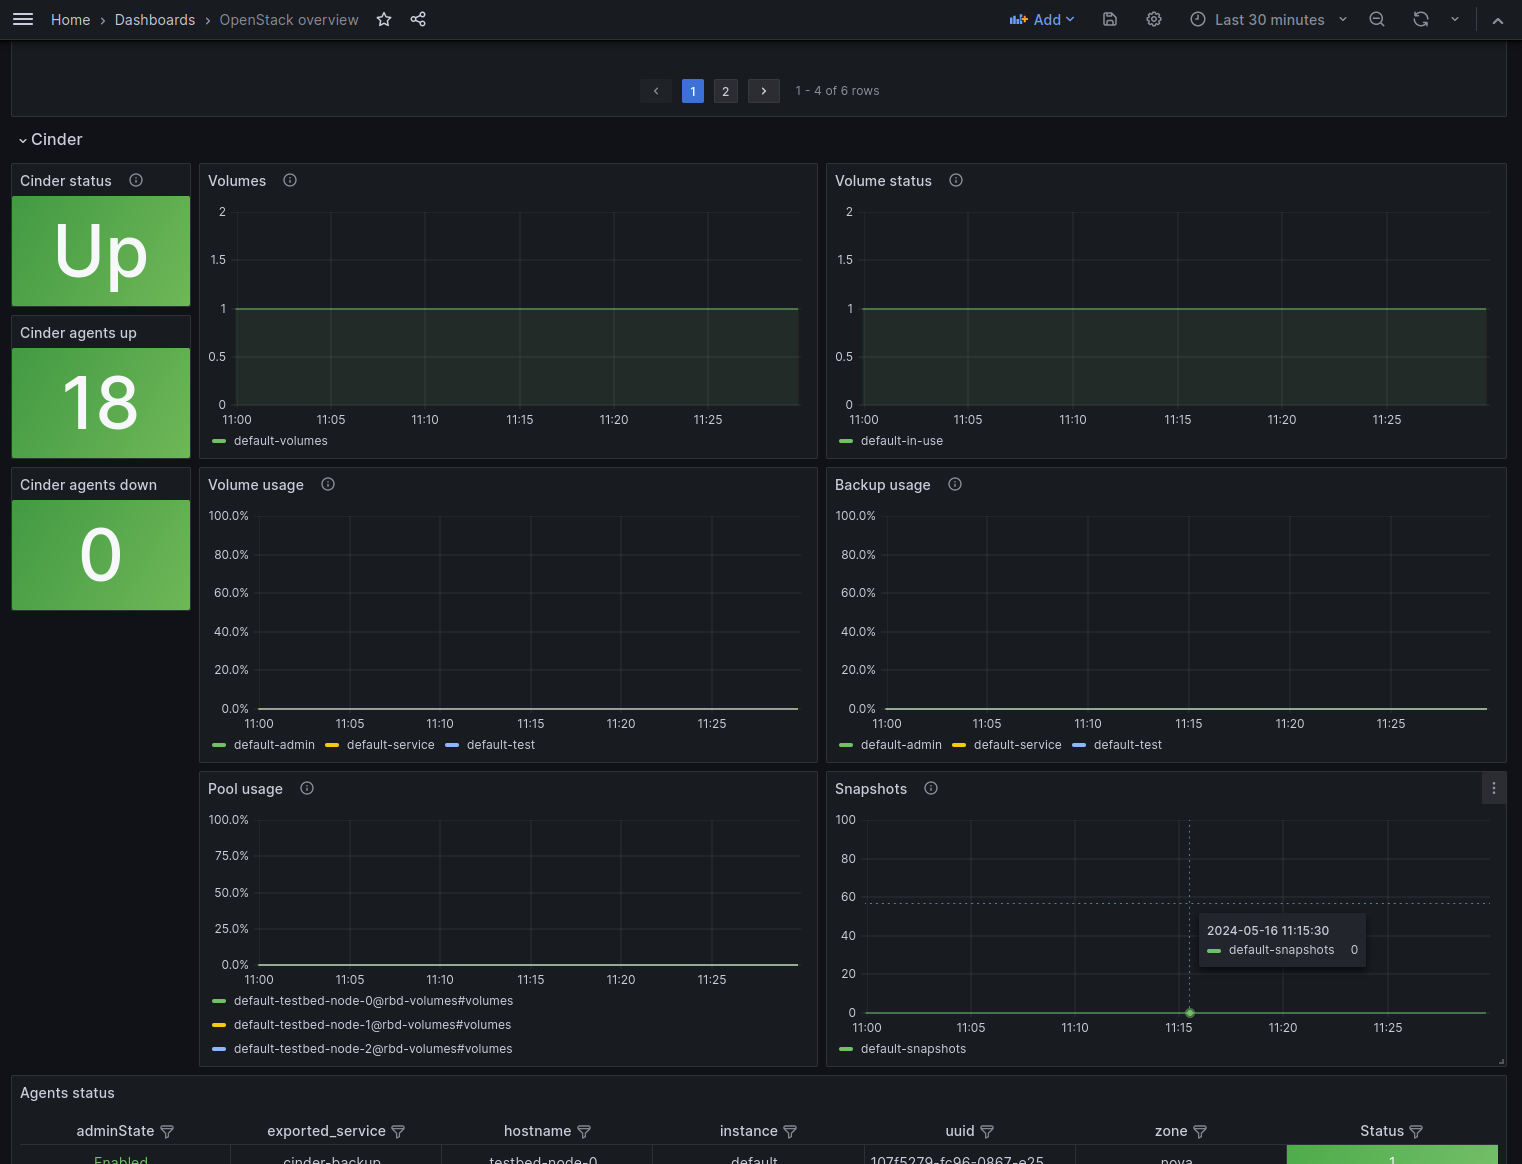
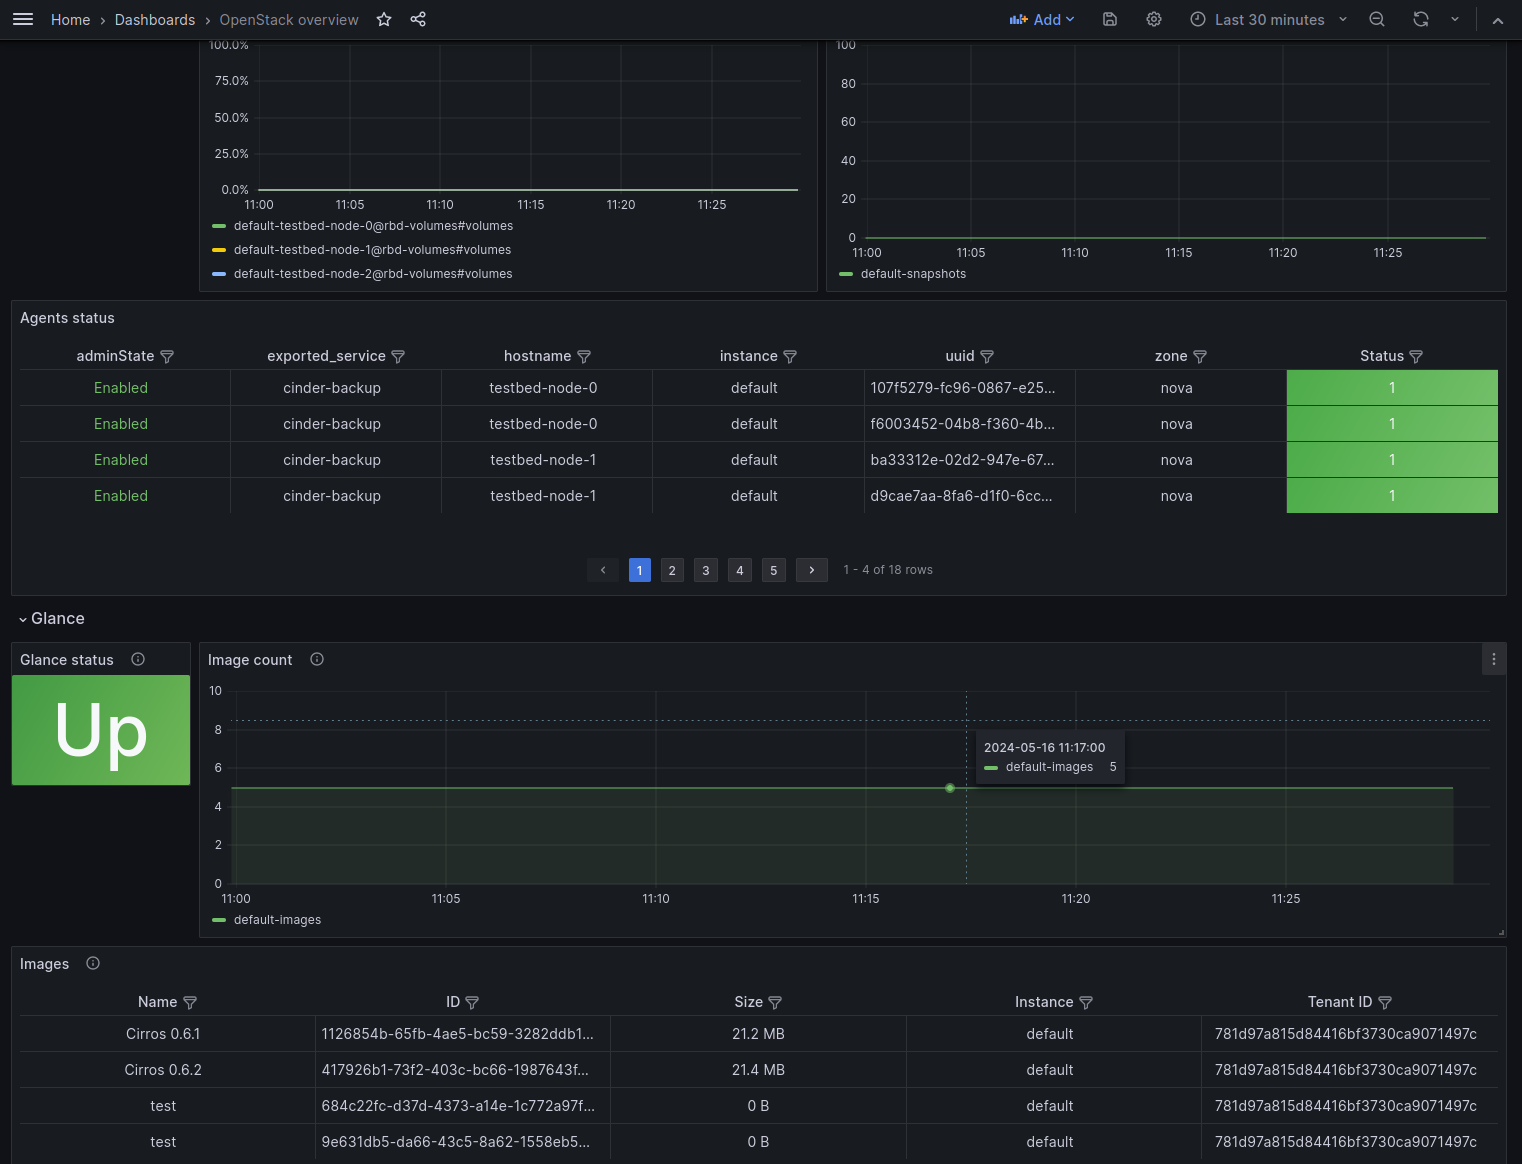
OpenStack dashboard using the Prometheus OpenStack exporter (https://github.com/openstack-exporter/openstack-exporter)
Screenshots
Used Metrics 1616
openstack_cinder_up
openstack_container_infra_up
openstack_designate_up
openstack_glance_up
openstack_gnocchi_up
openstack_heat_up
openstack_identity_up
openstack_ironic_up
openstack_loadbalancer_up
openstack_neutron_up
openstack_nova_up
openstack_object_store_up
openstack_placement_resource_total
openstack_placement_resource_usage
openstack_placement_up
openstack_trove_up
Get Dashboard✕
Download
Copy to Clipboard