Openshift/K8 Cluster Overview 94,03694,036
11/29/2017
1/30/2018
6
Docker
>=4.5.0
Prometheus
Description
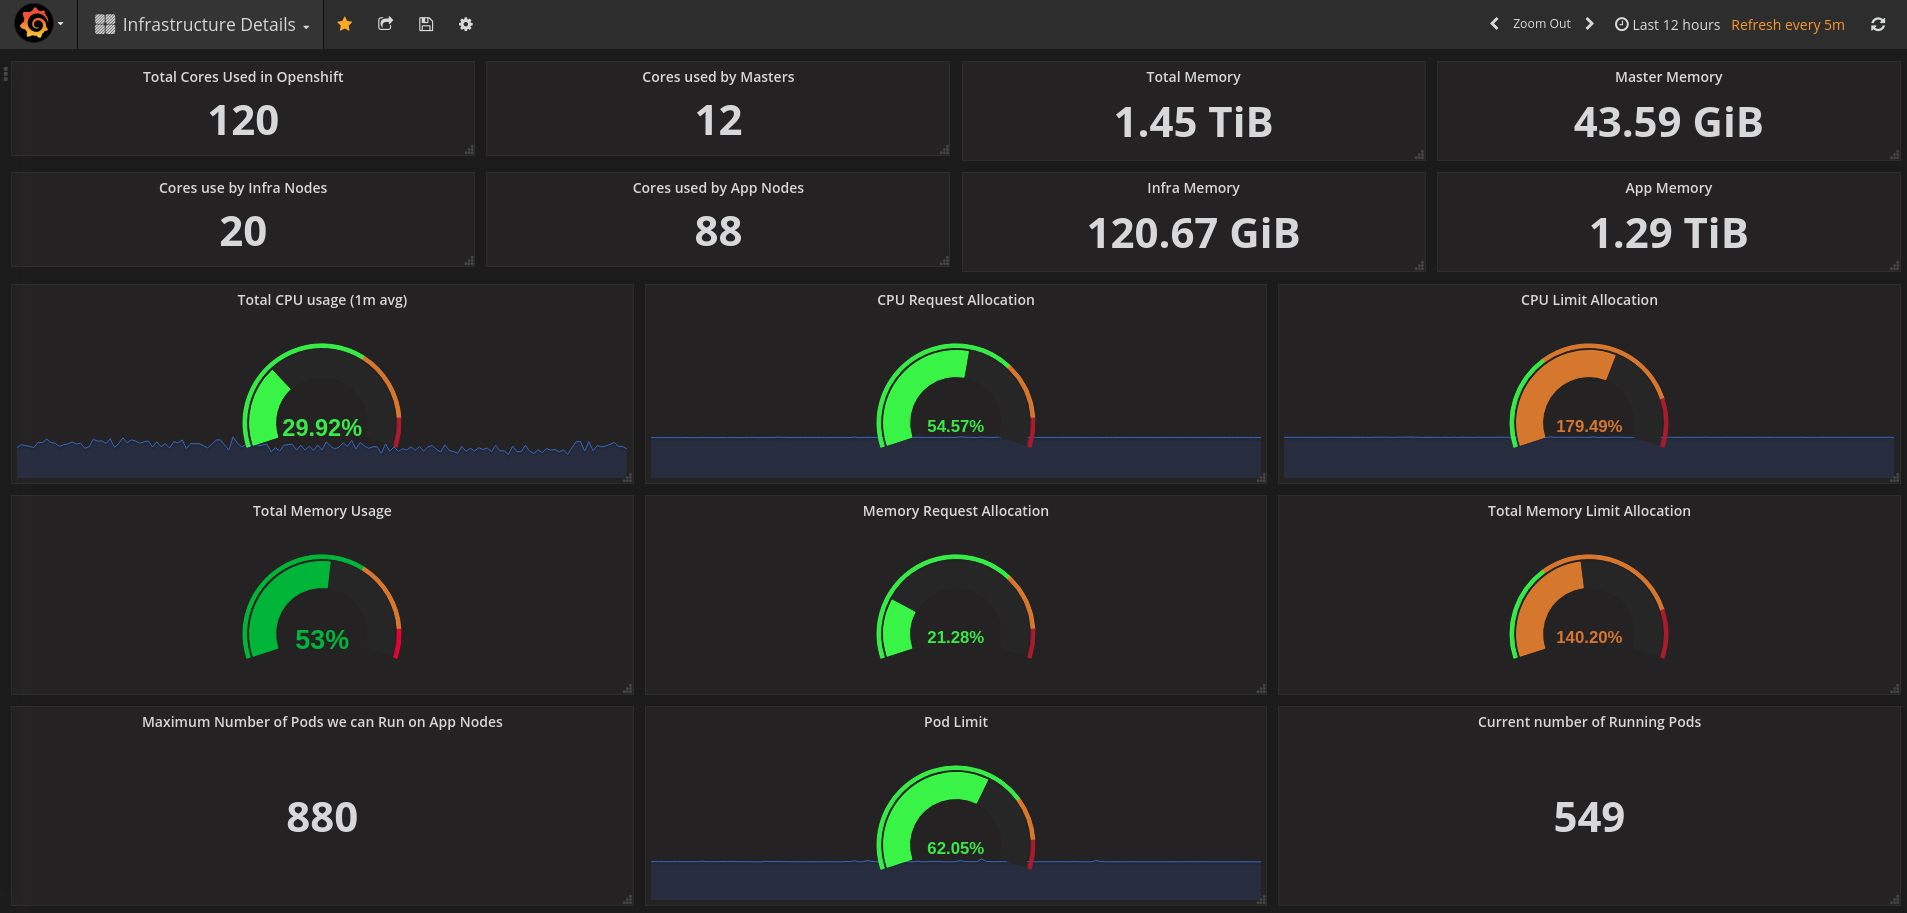
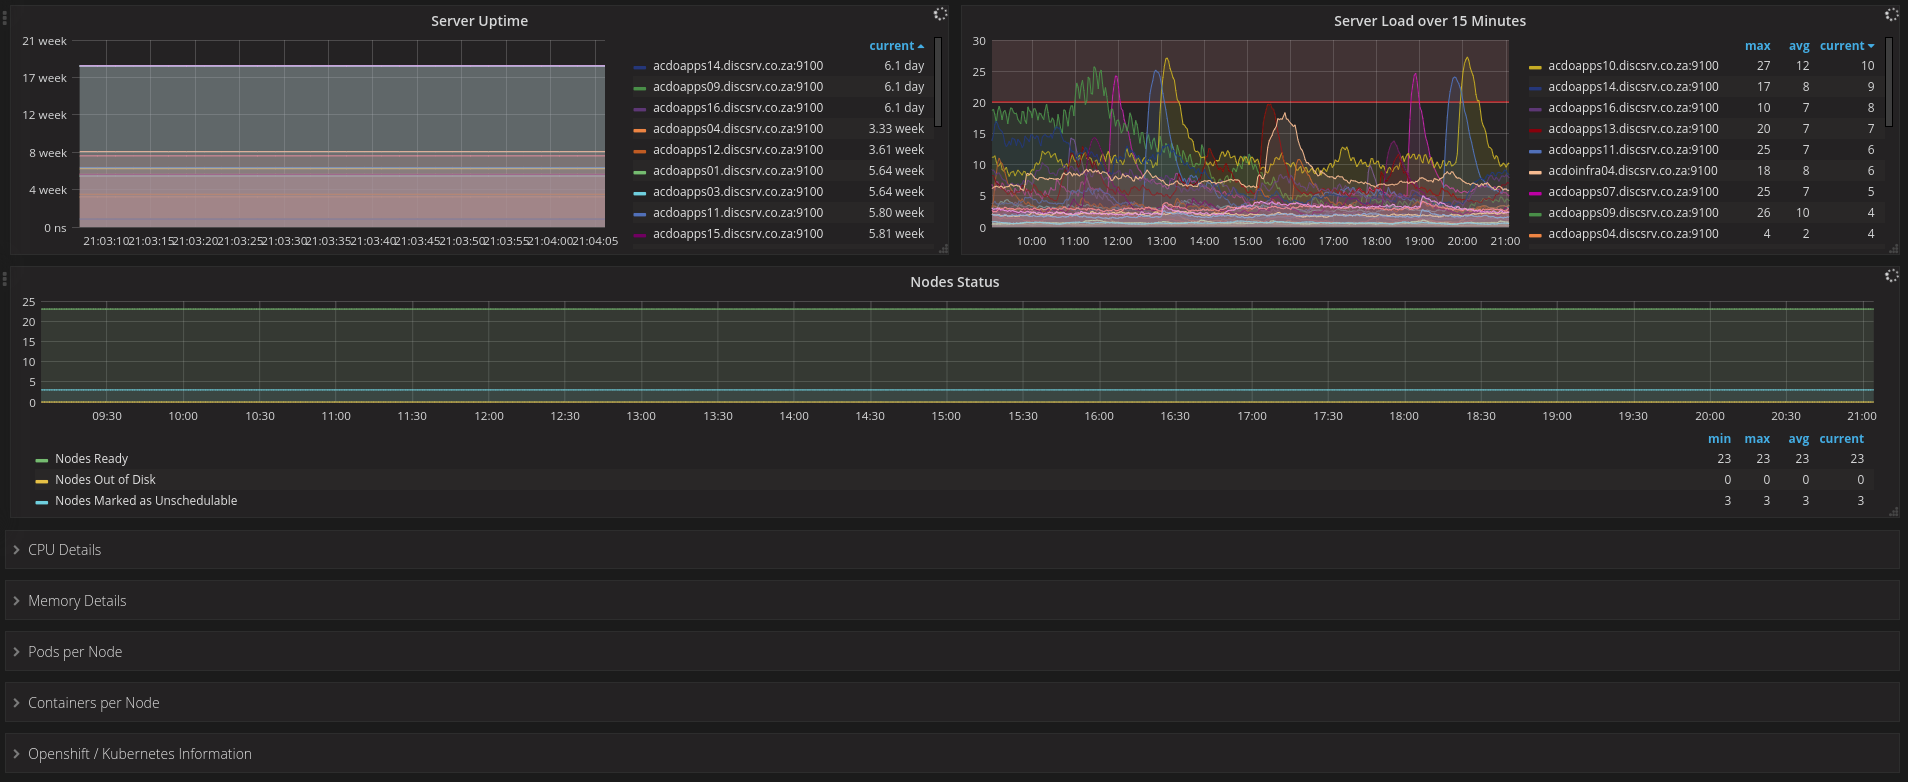
Monitors overall health and performance of the Kubernetes/OpenShift cluster, aggregating core control plane and node metrics to visualize utilization, capacity, and stability. Key features typically include real-time resource usage, apparent scheduling pressure, and cluster-wide health signals: for example, cpu_usage_core_seconds_per_minute, memory_working_set_bytes, and kube_node_status_condition/kube_pod_status_phase to track node readiness, pod states, and potential bottlenecks. This dashboard provides a concise, at-a-glance view of control plane latency, node/disk I/O, and pod workload distribution with drill-downs for temporal trends and alerting readiness.
Screenshots
Get Dashboard✕
Download
Copy to Clipboard