Ohm Windows Desktop 1,8511,851 5.0 (1 reviews)
Description
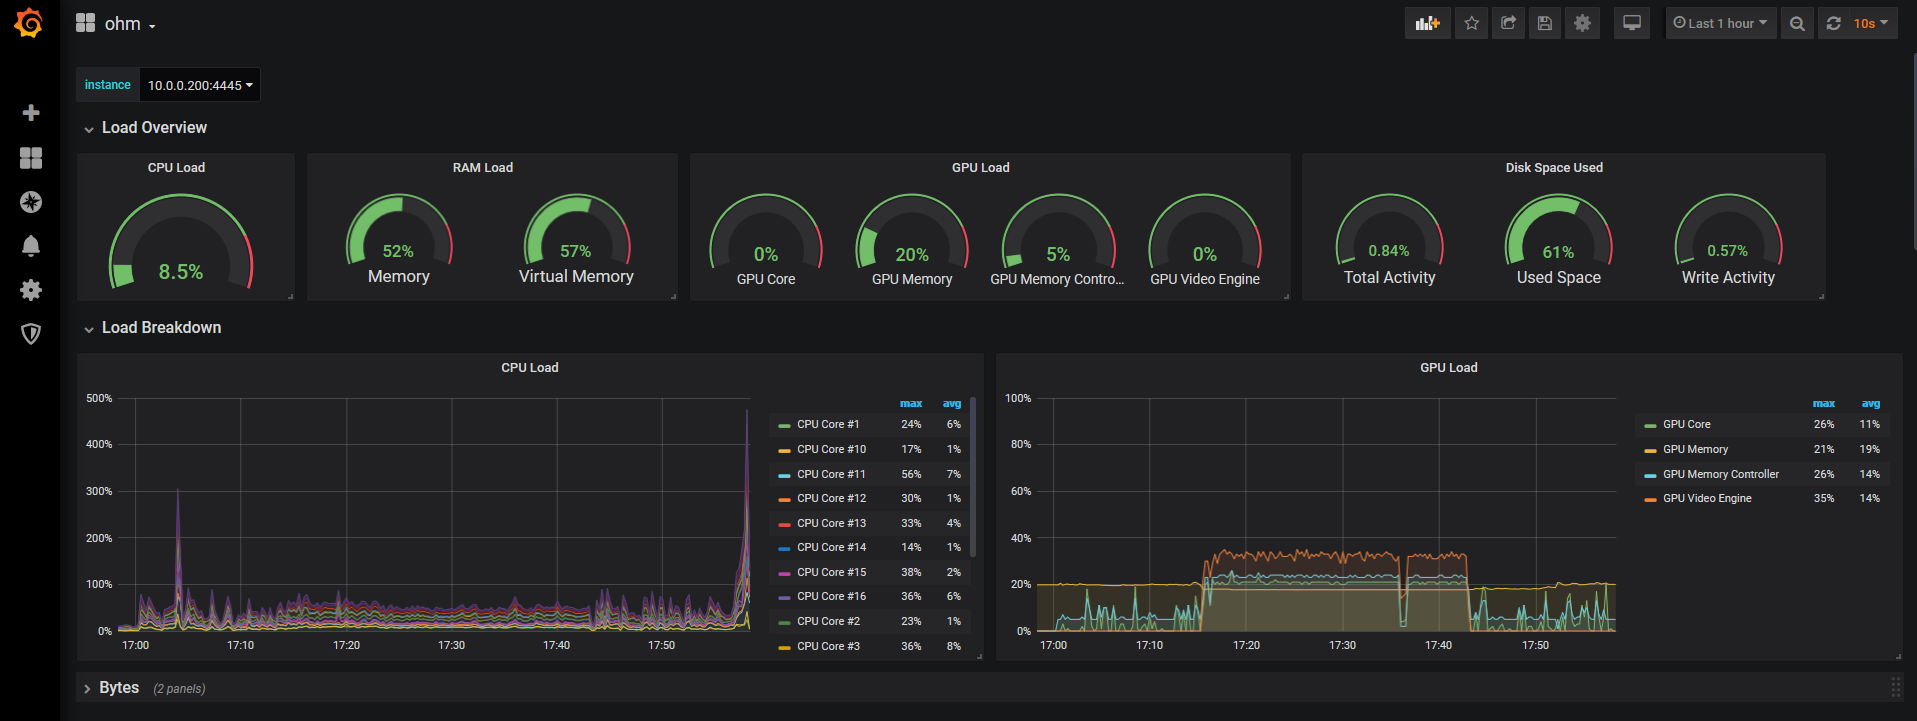
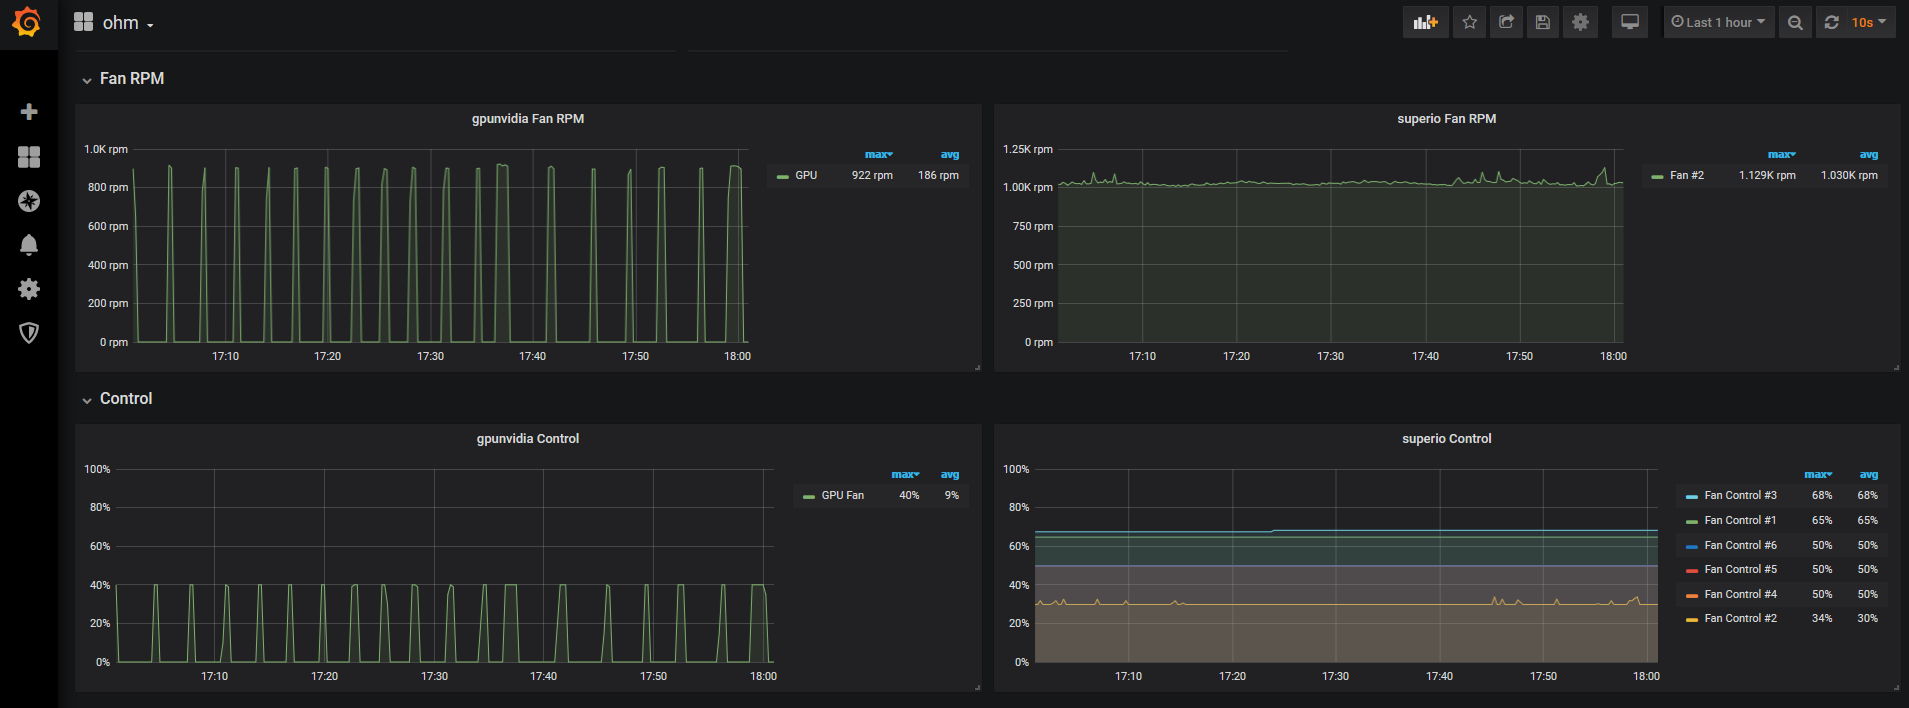
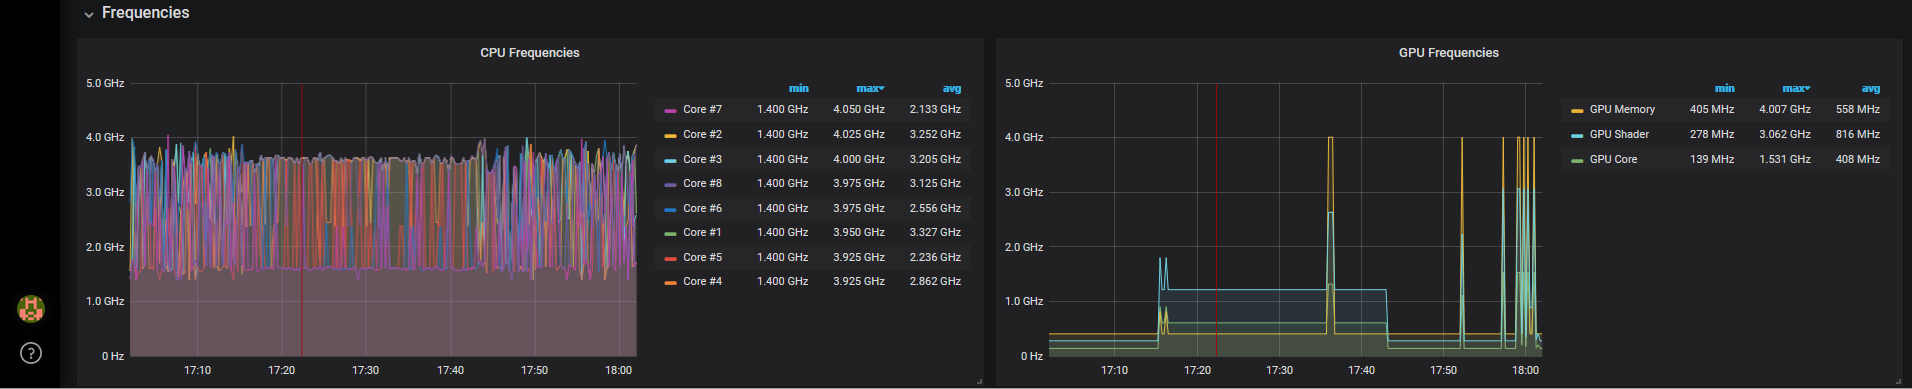
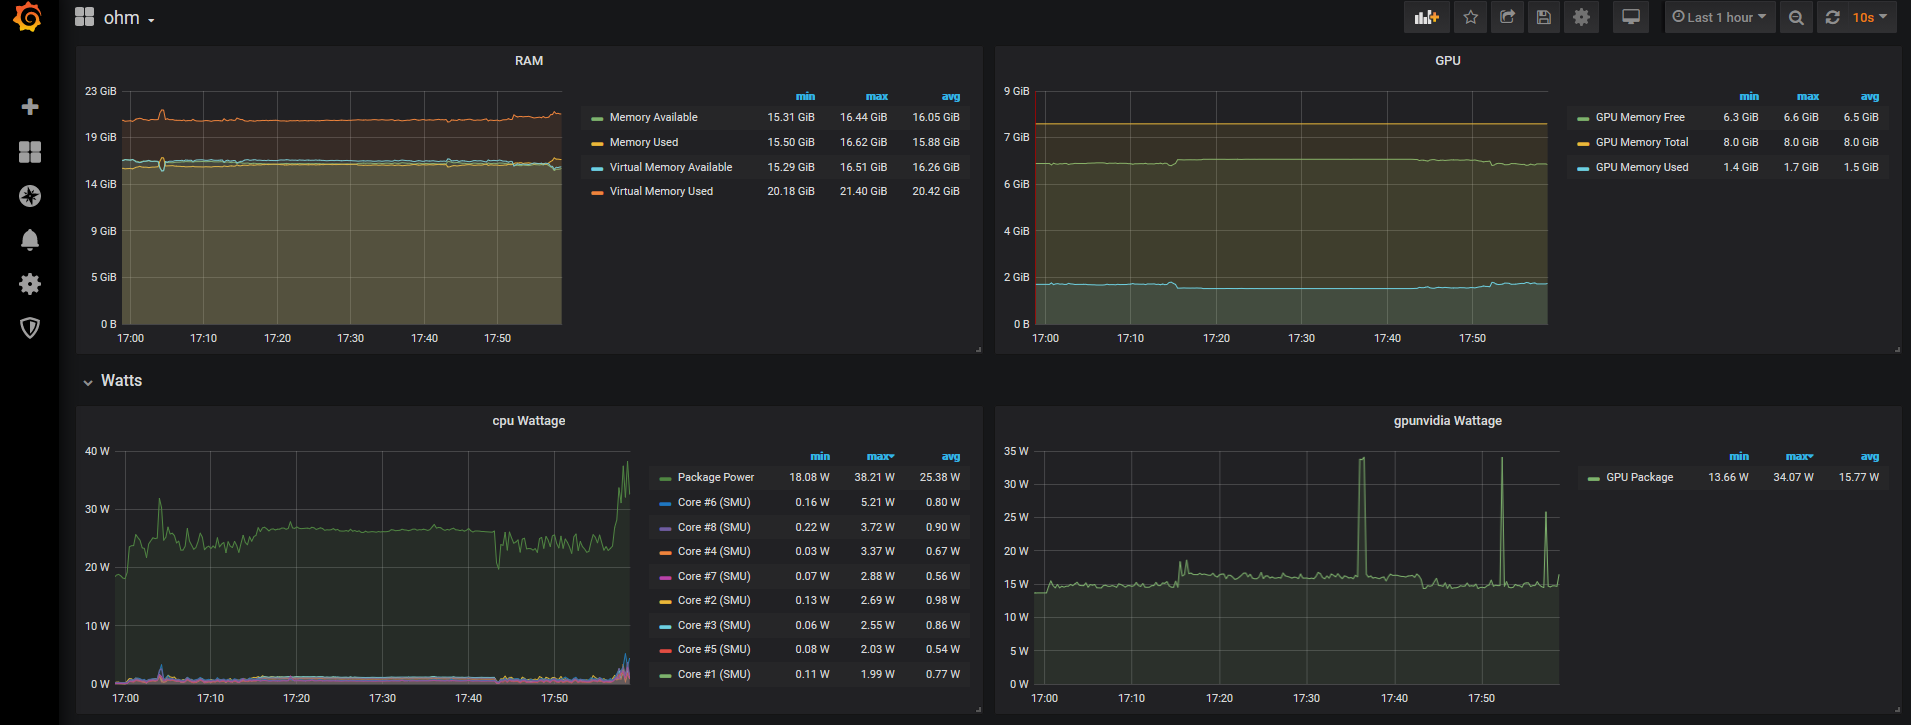
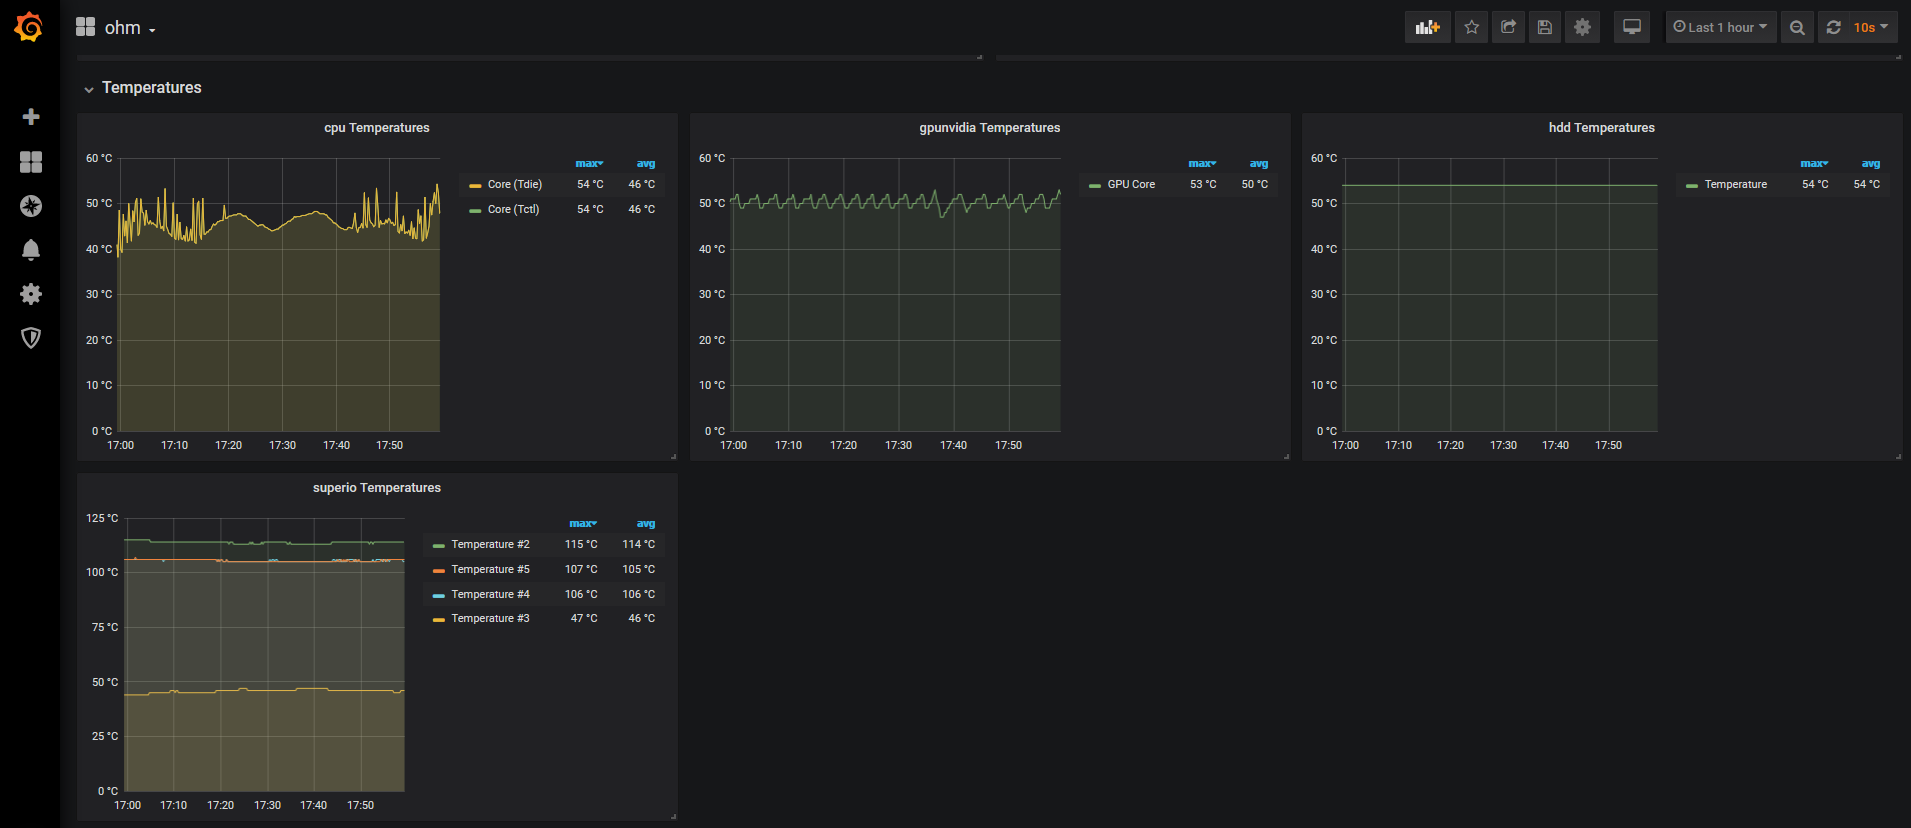
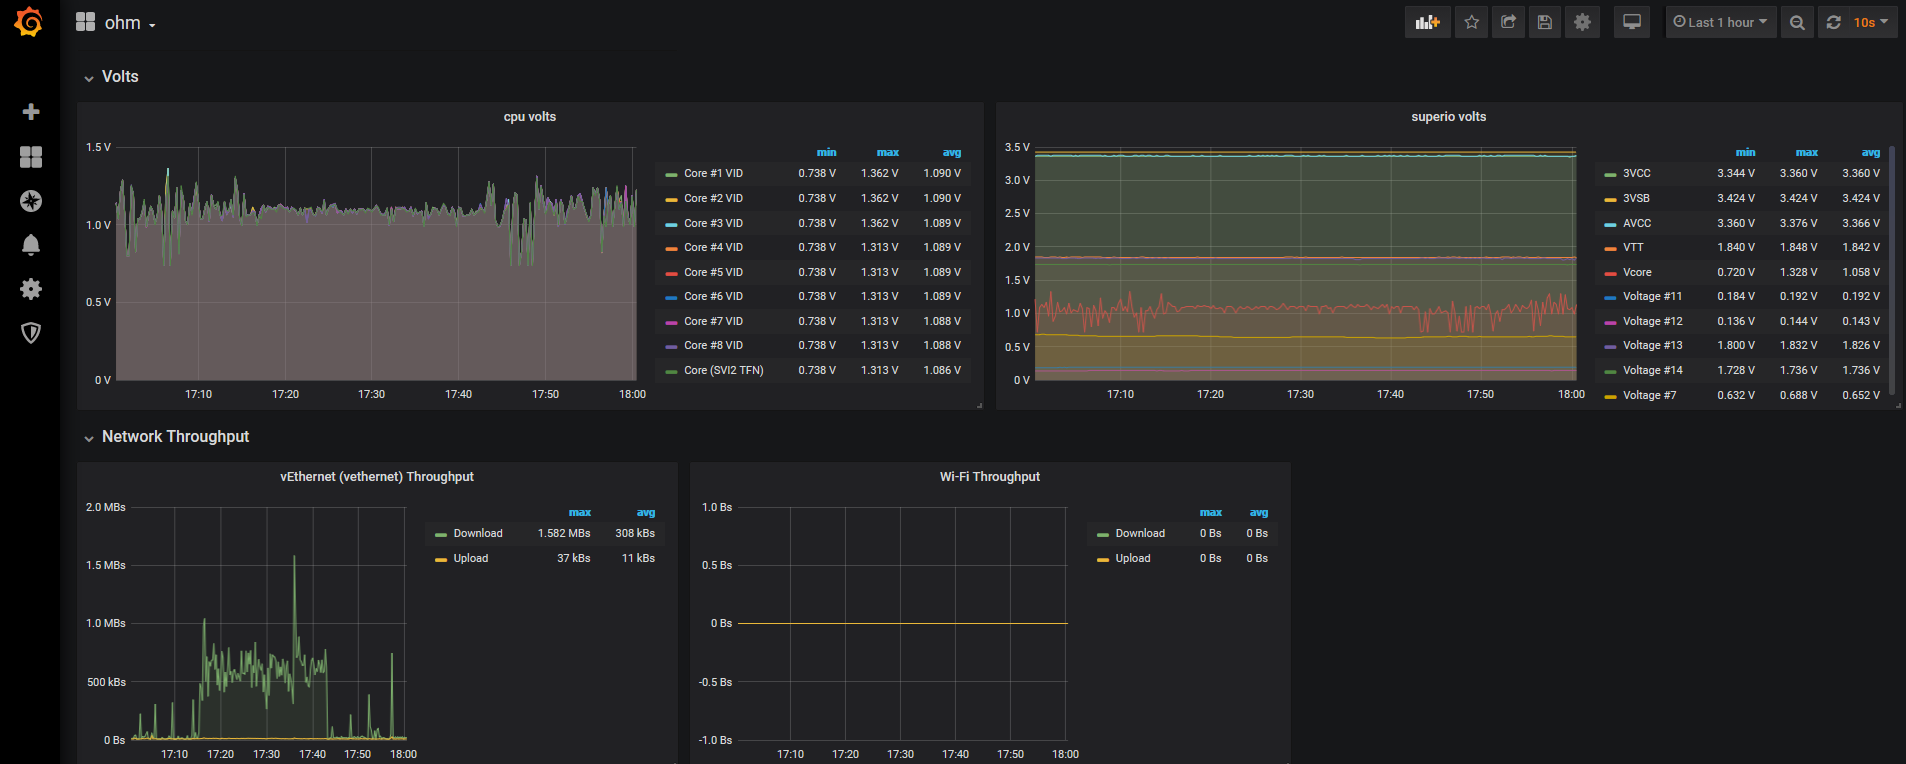
Screenshots
Used Metrics 4141
Hardware
__SensorGroup
__SensorID
_sensor
d
hardware
ohm_cpu_celsius
ohm_cpu_hertz
ohm_cpu_load_percent
ohm_cpu_volts
ohm_cpu_watts
ohm_gpuati_bytes
ohm_gpuati_bytes_per_second
ohm_gpuati_celsius
ohm_gpuati_control_percent
ohm_gpuati_hertz
ohm_gpuati_load_percent
ohm_gpuati_revolutions_per_minute
ohm_gpuati_watts
ohm_gpunvidia_bytes
ohm_gpunvidia_bytes_per_second
ohm_gpunvidia_celsius
ohm_gpunvidia_control_percent
ohm_gpunvidia_hertz
ohm_gpunvidia_load_percent
ohm_gpunvidia_revolutions_per_minute
ohm_gpunvidia_watts
ohm_hdd_bytes
ohm_hdd_bytes_per_second
ohm_hdd_celsius
ohm_hdd_factor
ohm_hdd_load_percent
ohm_nic_bytes
ohm_nic_bytes_per_second
ohm_nic_load_percent
ohm_ram_load_percent
ohm_superio_celsius
ohm_superio_control_percent
ohm_superio_revolutions_per_minute
ohm_superio_volts
sensor