NVIDIA GPU metrics dashboard 878878
1/17/2020
1/17/2020
1
AWSDockerHost Metrics
>=6.5.2
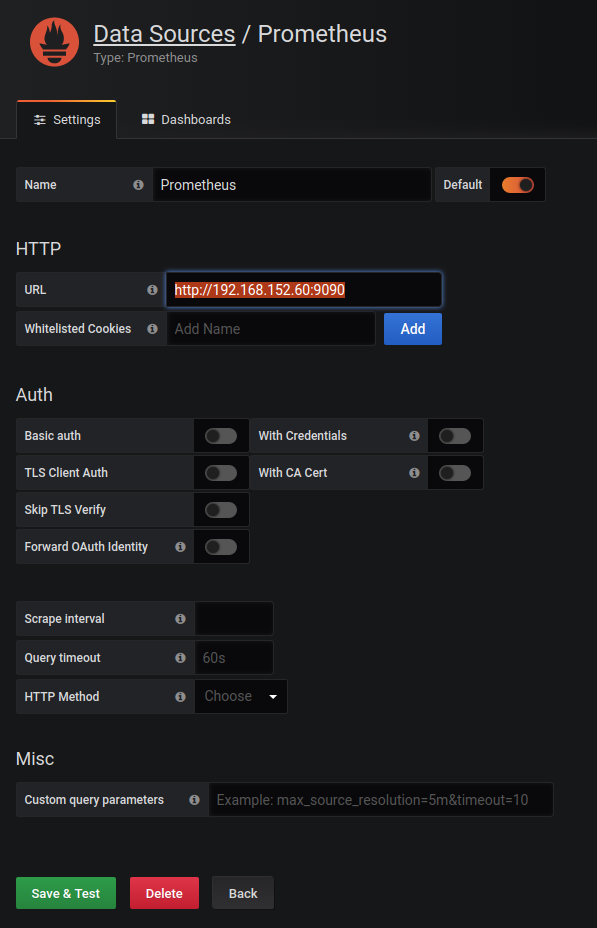
Prometheus
Description
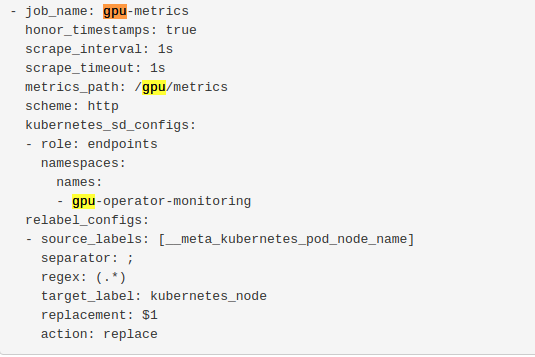
This dashboard is to display NVIDIA GPU Kubernetes cluster metrics version +1.13
Screenshots
Used Metrics 88
dcgm_fb_free
dcgm_fb_used
dcgm_gpu_temp
dcgm_gpu_utilization
dcgm_mem_copy_utilization
dcgm_memory_clock
dcgm_power_usage
dcgm_sm_clock
Get Dashboard✕
Download
Copy to Clipboard