NVIDIA DCGM Exporter Dashboard 28,706,99228,706,992 3.5 (8 reviews)
5/6/2020
9/23/2021
2
>=6.7.3
Prometheus
Description
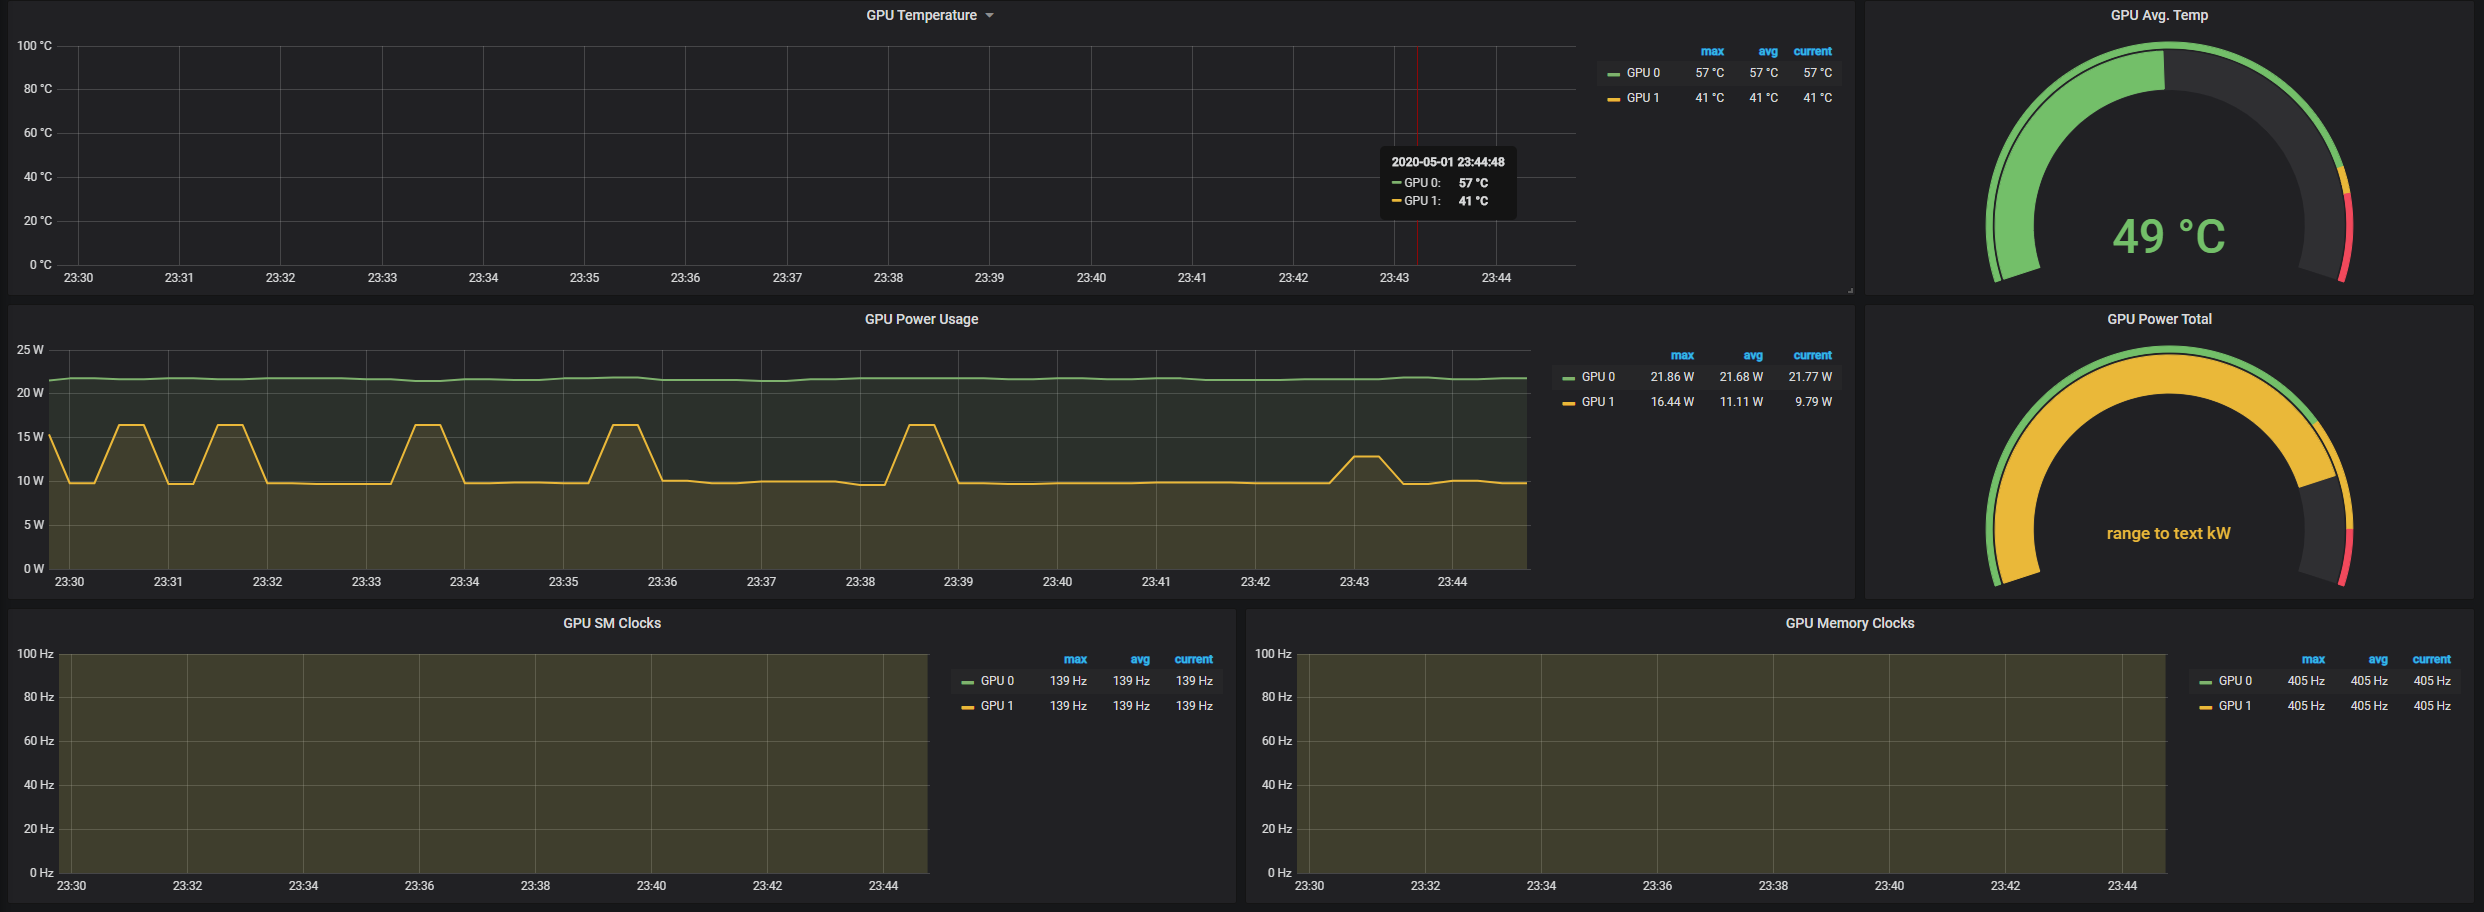
This Grafana dashboard monitors NVIDIA GPU health and performance by aggregating DCGM-exported metrics into a cohesive view of temperature, power, clock speeds, memory usage, and compute utilization. It highlights both real-time hardware states and profiling data (including tensor activity) to help diagnose thermal risks, power budgets, and overall GPU throughput, with panels focused on per-GPU metrics and totalized usage.
Screenshots
Used Metrics 77
DCGM_FI_DEV_FB_USED
DCGM_FI_DEV_GPU_TEMP
DCGM_FI_DEV_GPU_UTIL
DCGM_FI_DEV_POWER_USAGE
DCGM_FI_DEV_SM_CLOCK
DCGM_FI_PROF_PIPE_TENSOR_ACTIVE
gpu
Get Dashboard✕
Download
Copy to Clipboard