NVIDIA DCGM Exporter Dashboard 615,914615,914
Description
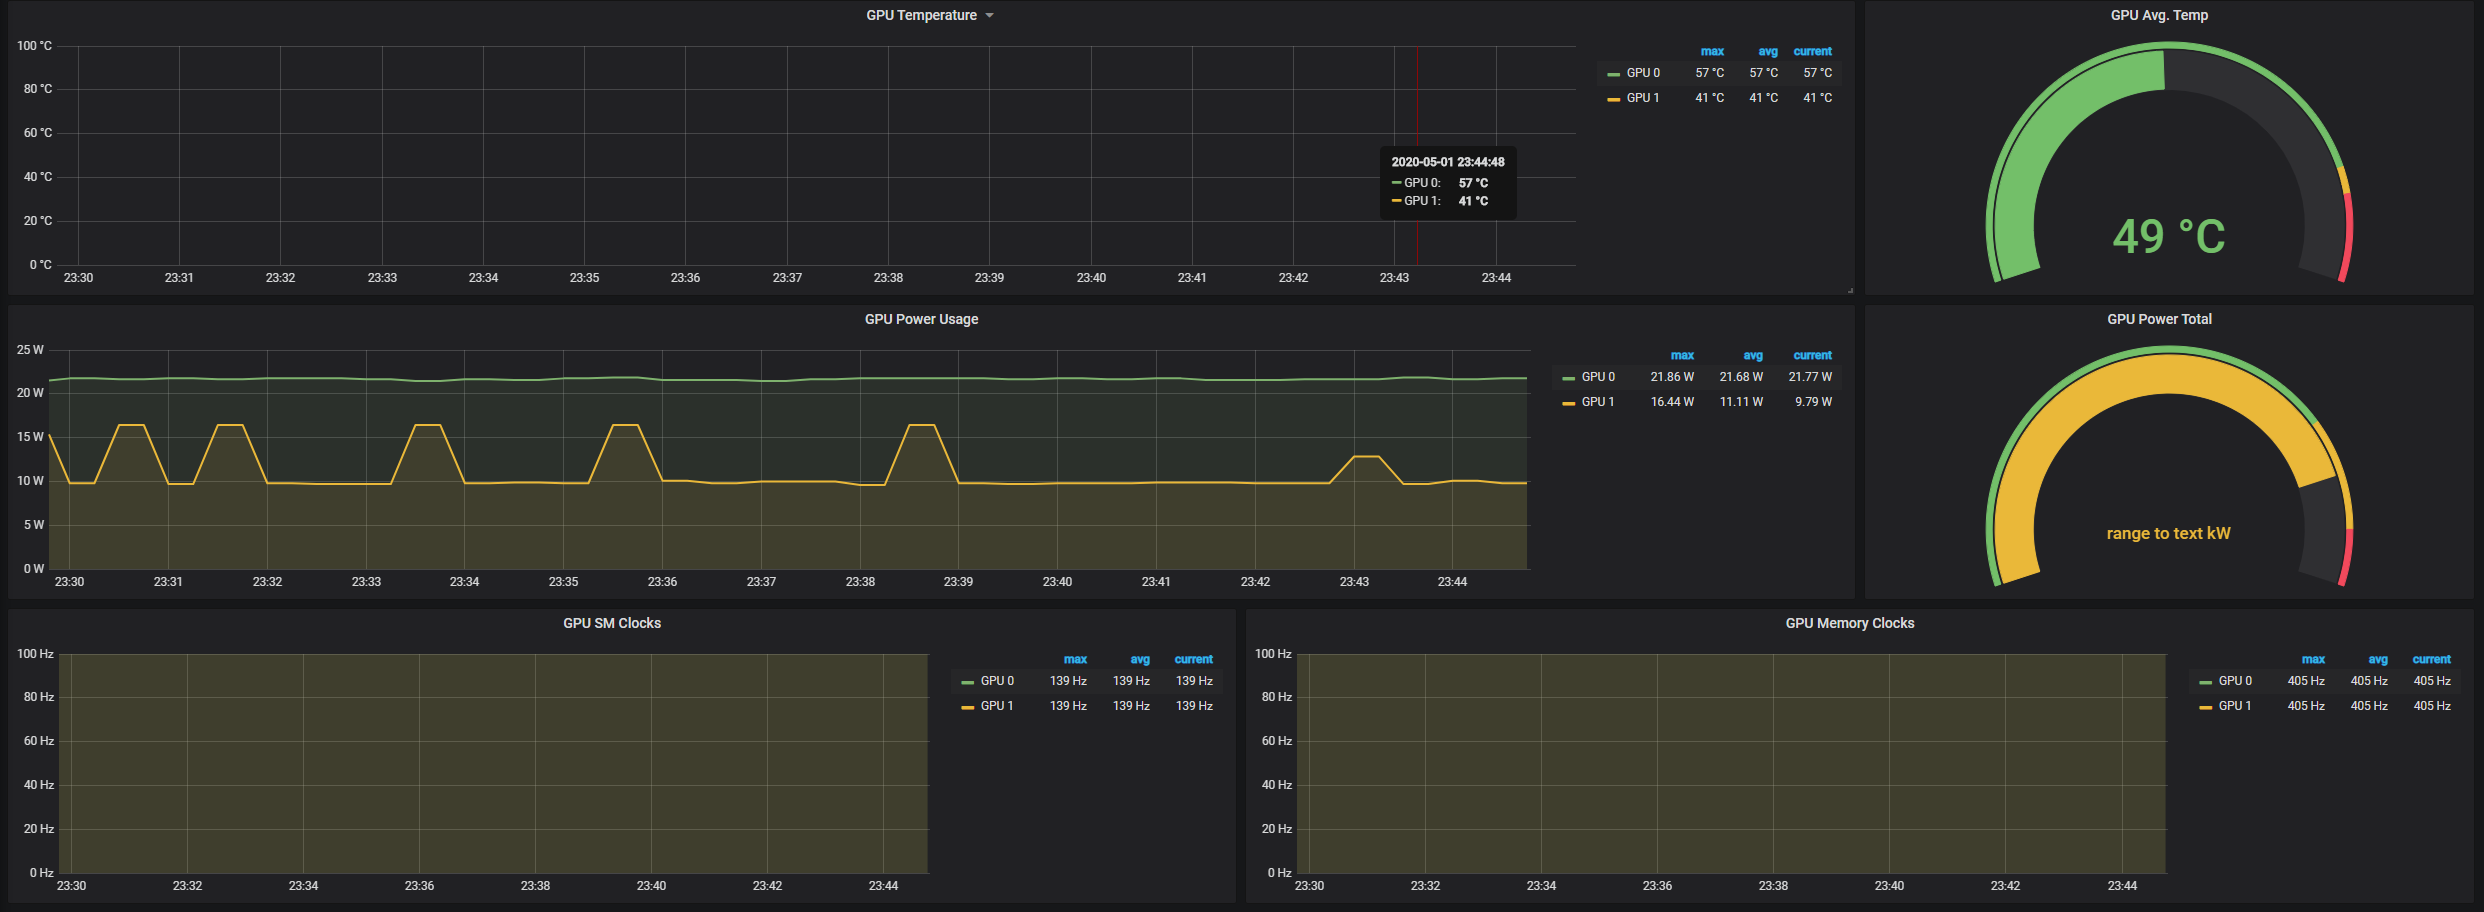
This dashboard monitors NVIDIA GPU health and performance by visualizing key DCGM metrics such as DCGM_FI_DEV_GPU_TEMP for thermal status and DCGM_FI_DEV_POWER_USAGE for power draw. It also highlights compute capability indicators like DCGM_FI_DEV_SM_CLOCK and DCGM_FI_DEV_MEM_CLOCK, along with utilization metrics such as DCGM_FI_DEV_GPU_UTIL and memory activity including DCGM_FI_DEV_MEM_COPY_UTIL and DCGM_FI_DEV_FB_USED to track bandwidth, memory usage, and efficiency across GPUs. Panels present real-time gauges and time-series plots to quickly identify hotspots, bottlenecks, and overall GPU utilization trends.
Screenshots
Used Metrics 77
DCGM_FI_DEV_FB_USED
DCGM_FI_DEV_GPU_TEMP
DCGM_FI_DEV_GPU_UTIL
DCGM_FI_DEV_MEM_CLOCK
DCGM_FI_DEV_MEM_COPY_UTIL
DCGM_FI_DEV_POWER_USAGE
DCGM_FI_DEV_SM_CLOCK