NVIDIA DCGM Dashboard for Kubernetes (MIG & Non-MIG GPUs) 1,4411,441
5/5/2025
5/6/2025
1
>=11.2.0
Prometheus
Description
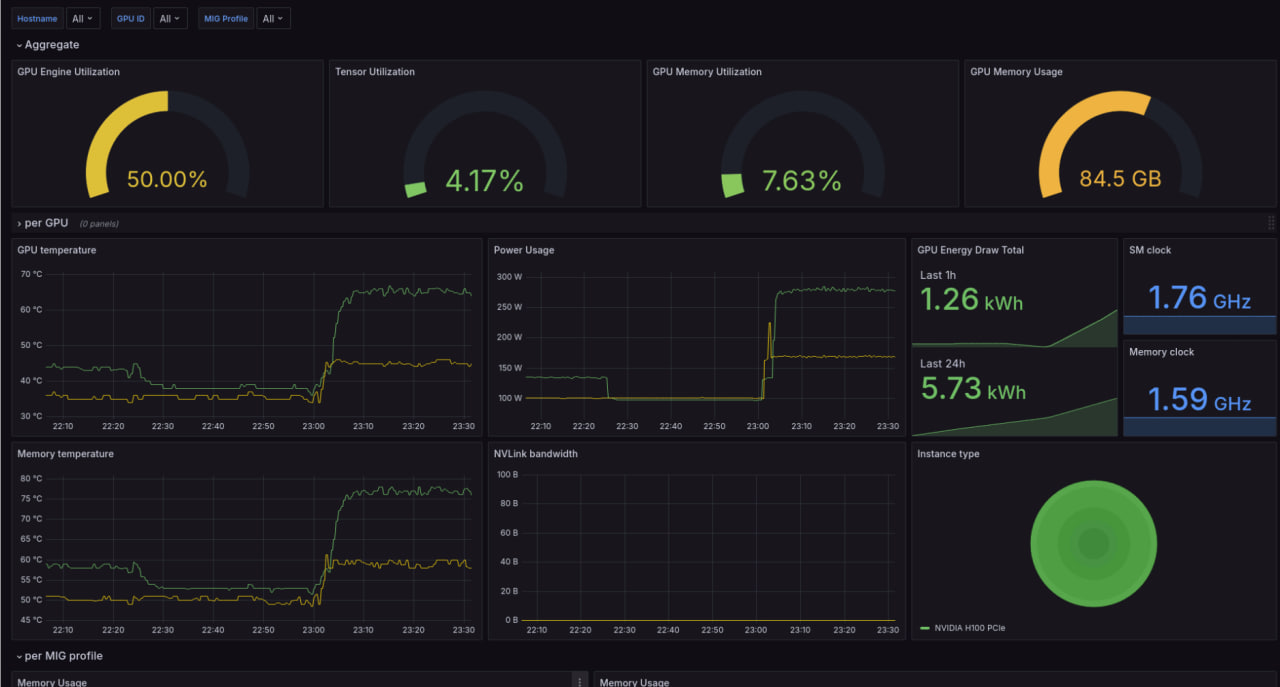
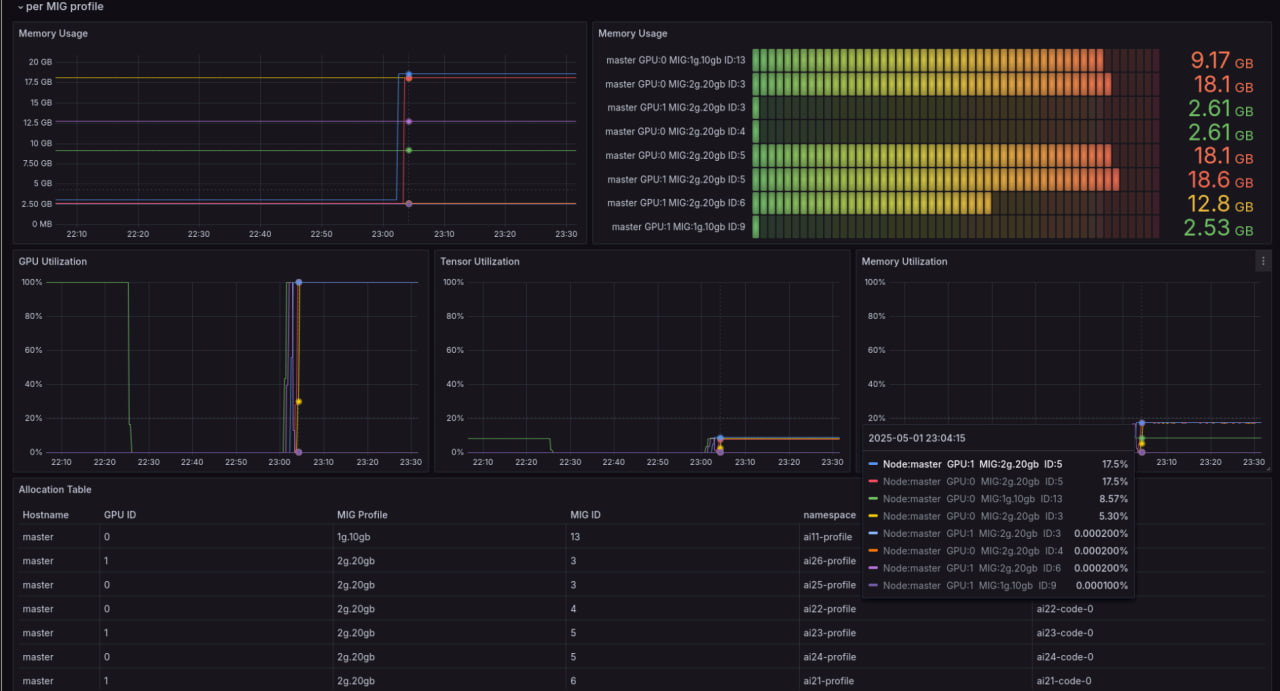
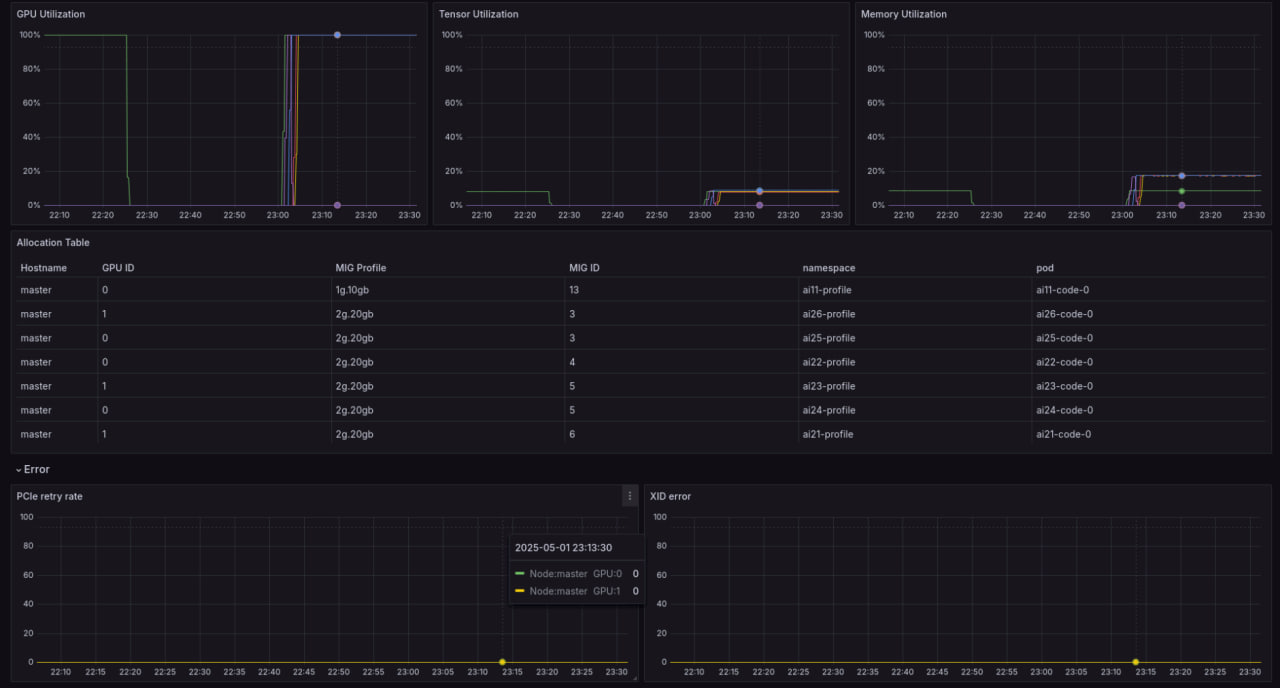
This Grafana dashboard uses the NVIDIA DCGM exporter to monitor GPU performance in Kubernetes clusters. Supporting both MIG and non-MIG GPUs, it provides real-time metrics on utilization, memory, temperature, power, and more, enabling efficient management of NVIDIA GPU resources.
Screenshots
Used Metrics 1414
DCGM_FI_DEV_FB_FREE
DCGM_FI_DEV_FB_USED
DCGM_FI_DEV_GPU_TEMP
DCGM_FI_DEV_MEMORY_TEMP
DCGM_FI_DEV_MEM_CLOCK
DCGM_FI_DEV_NVLINK_BANDWIDTH_TOTAL
DCGM_FI_DEV_PCIE_REPLAY_COUNTER
DCGM_FI_DEV_POWER_USAGE
DCGM_FI_DEV_SM_CLOCK
DCGM_FI_DEV_TOTAL_ENERGY_CONSUMPTION
DCGM_FI_DEV_XID_ERRORS
DCGM_FI_PROF_DRAM_ACTIVE
DCGM_FI_PROF_GR_ENGINE_ACTIVE
DCGM_FI_PROF_PIPE_TENSOR_ACTIVE
Get Dashboard✕
Download
Copy to Clipboard