Nomad Cluster 4,2804,280
5/27/2018
5/27/2018
1
DockerHost Metrics
>=5.1.2
Prometheus
Description
Nomad built-in telemetry https://github.com/dereknex/nomad-grafana
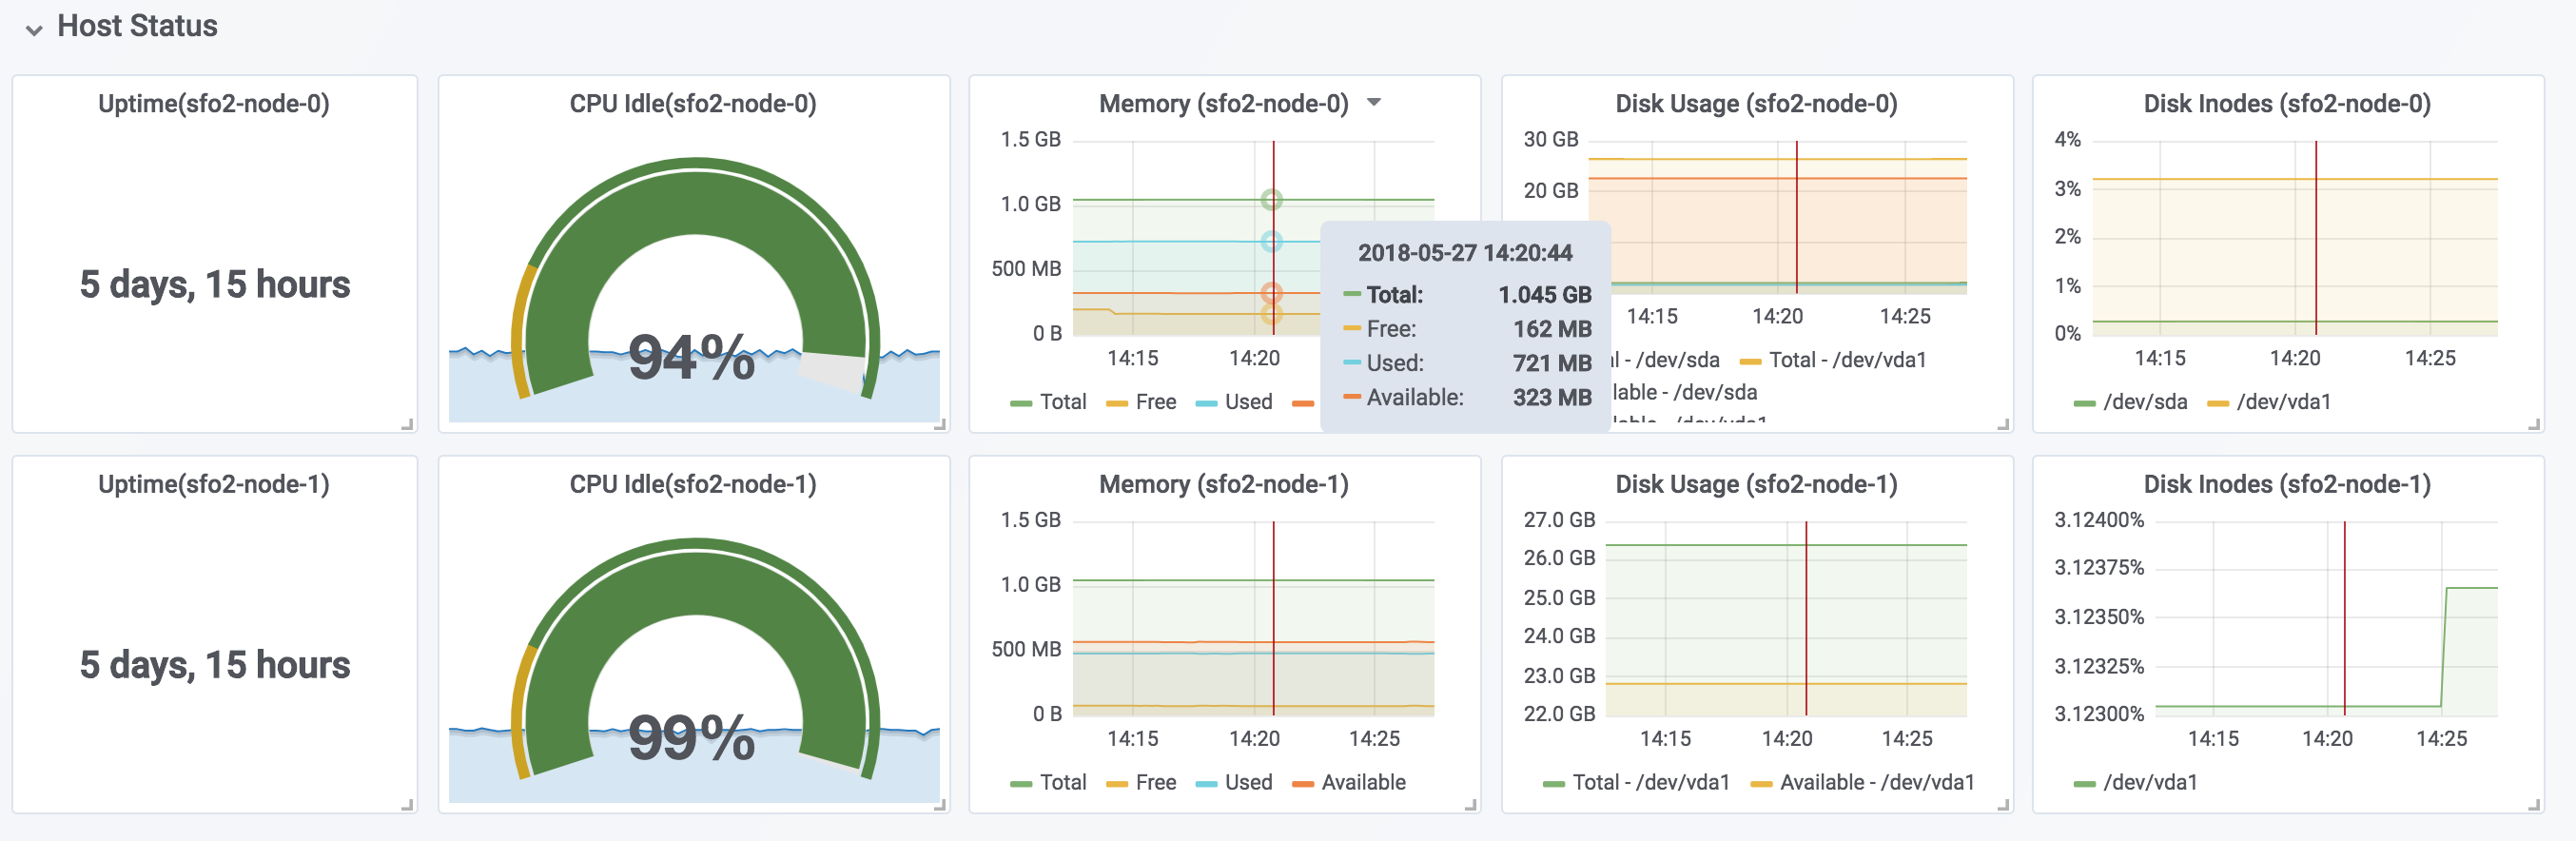
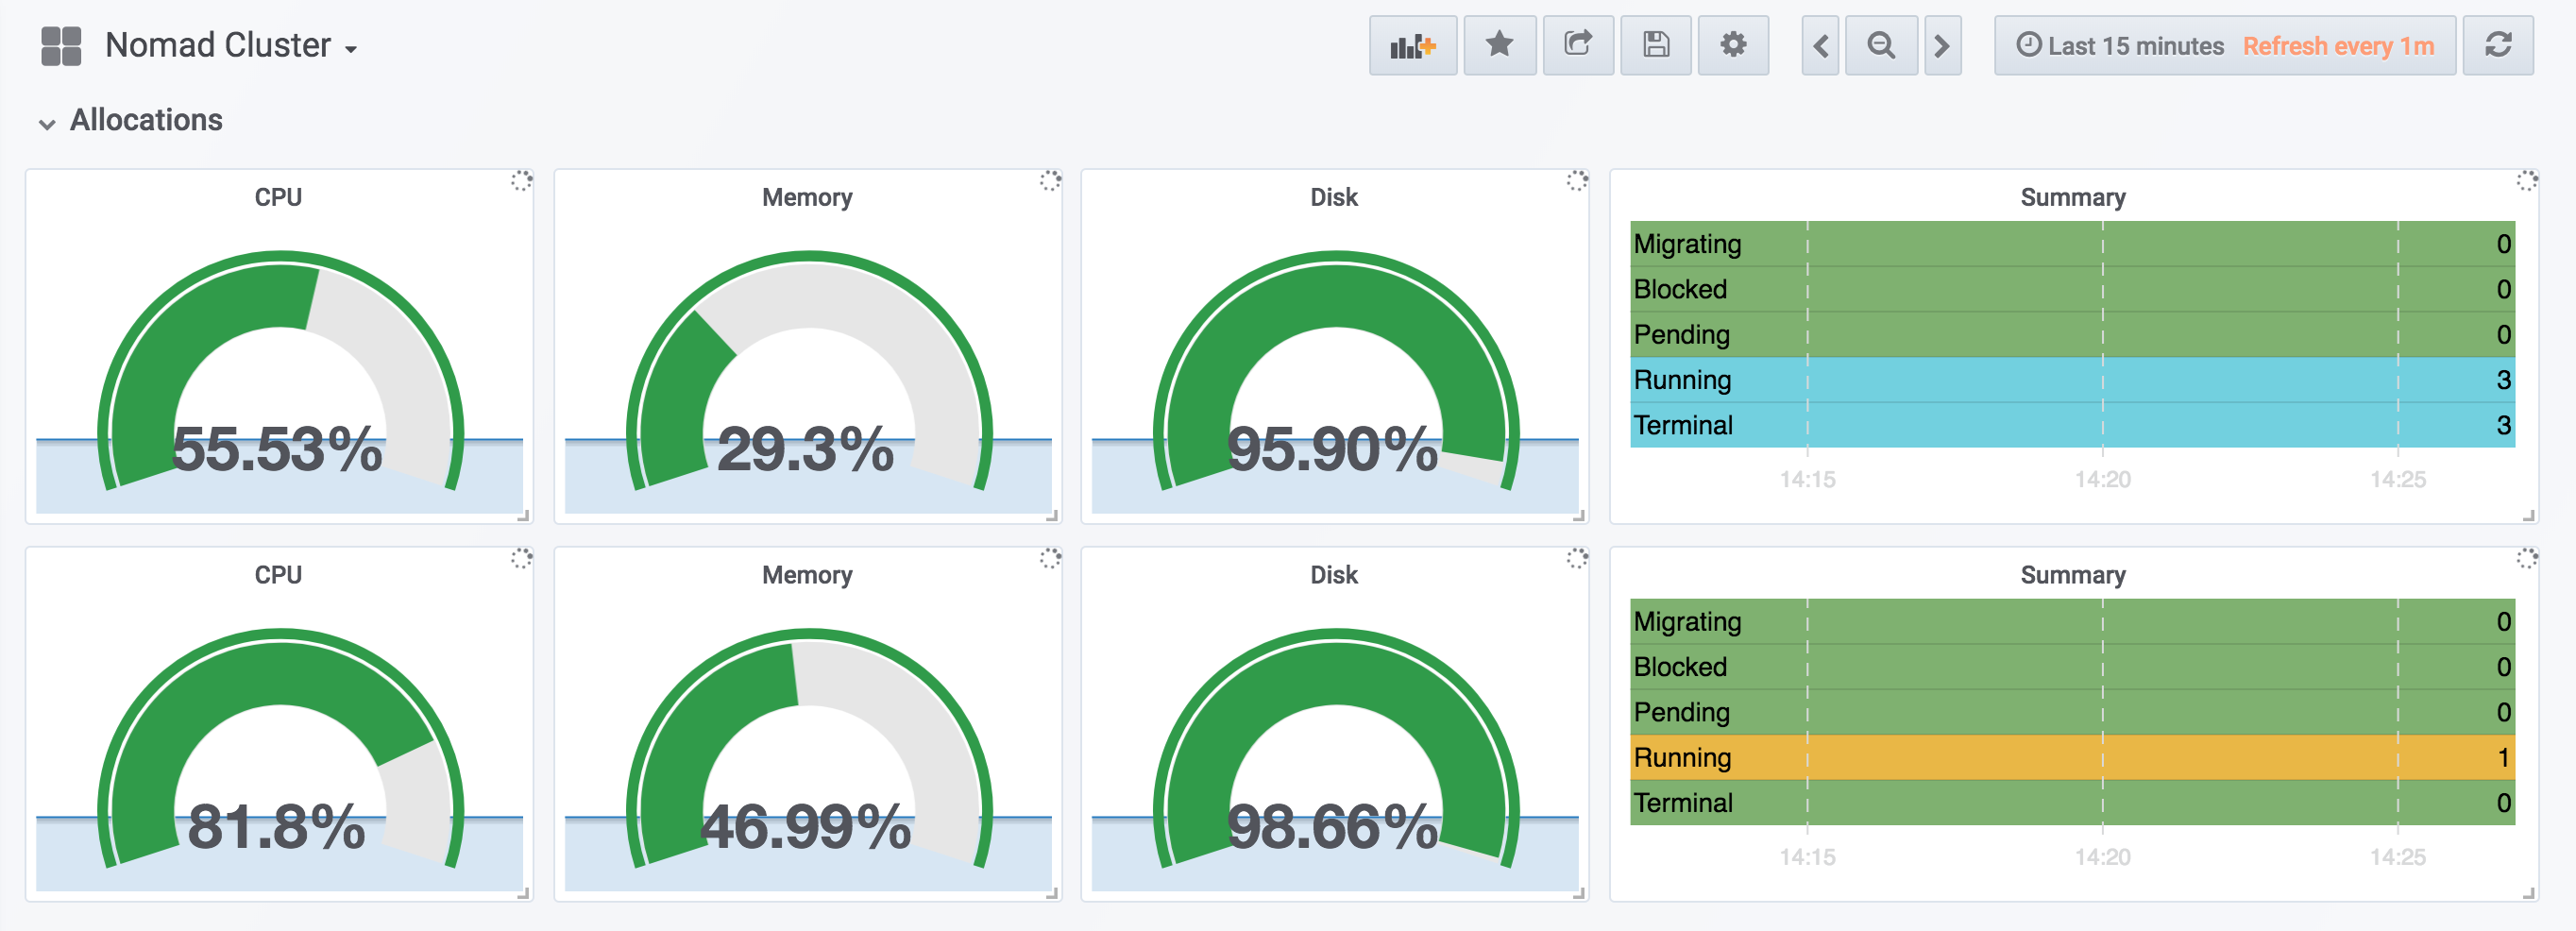
Screenshots
Used Metrics 2020
nomad_client_allocated_cpu
nomad_client_allocated_disk
nomad_client_allocated_memory
nomad_client_allocations_blocked
nomad_client_allocations_migrating
nomad_client_allocations_pending
nomad_client_allocations_running
nomad_client_allocations_terminal
nomad_client_host_cpu_idle
nomad_client_host_disk_available
nomad_client_host_disk_inodes_percent
nomad_client_host_disk_size
nomad_client_host_memory_available
nomad_client_host_memory_free
nomad_client_host_memory_total
nomad_client_host_memory_used
nomad_client_unallocated_cpu
nomad_client_unallocated_disk
nomad_client_unallocated_memory
nomad_client_uptime
Get Dashboard✕
Download
Copy to Clipboard