Nodes - Metrics Server Monitor Prometheus 2,9222,922
11/1/2018
11/1/2018
1
>=5.0.4
Prometheus
Description
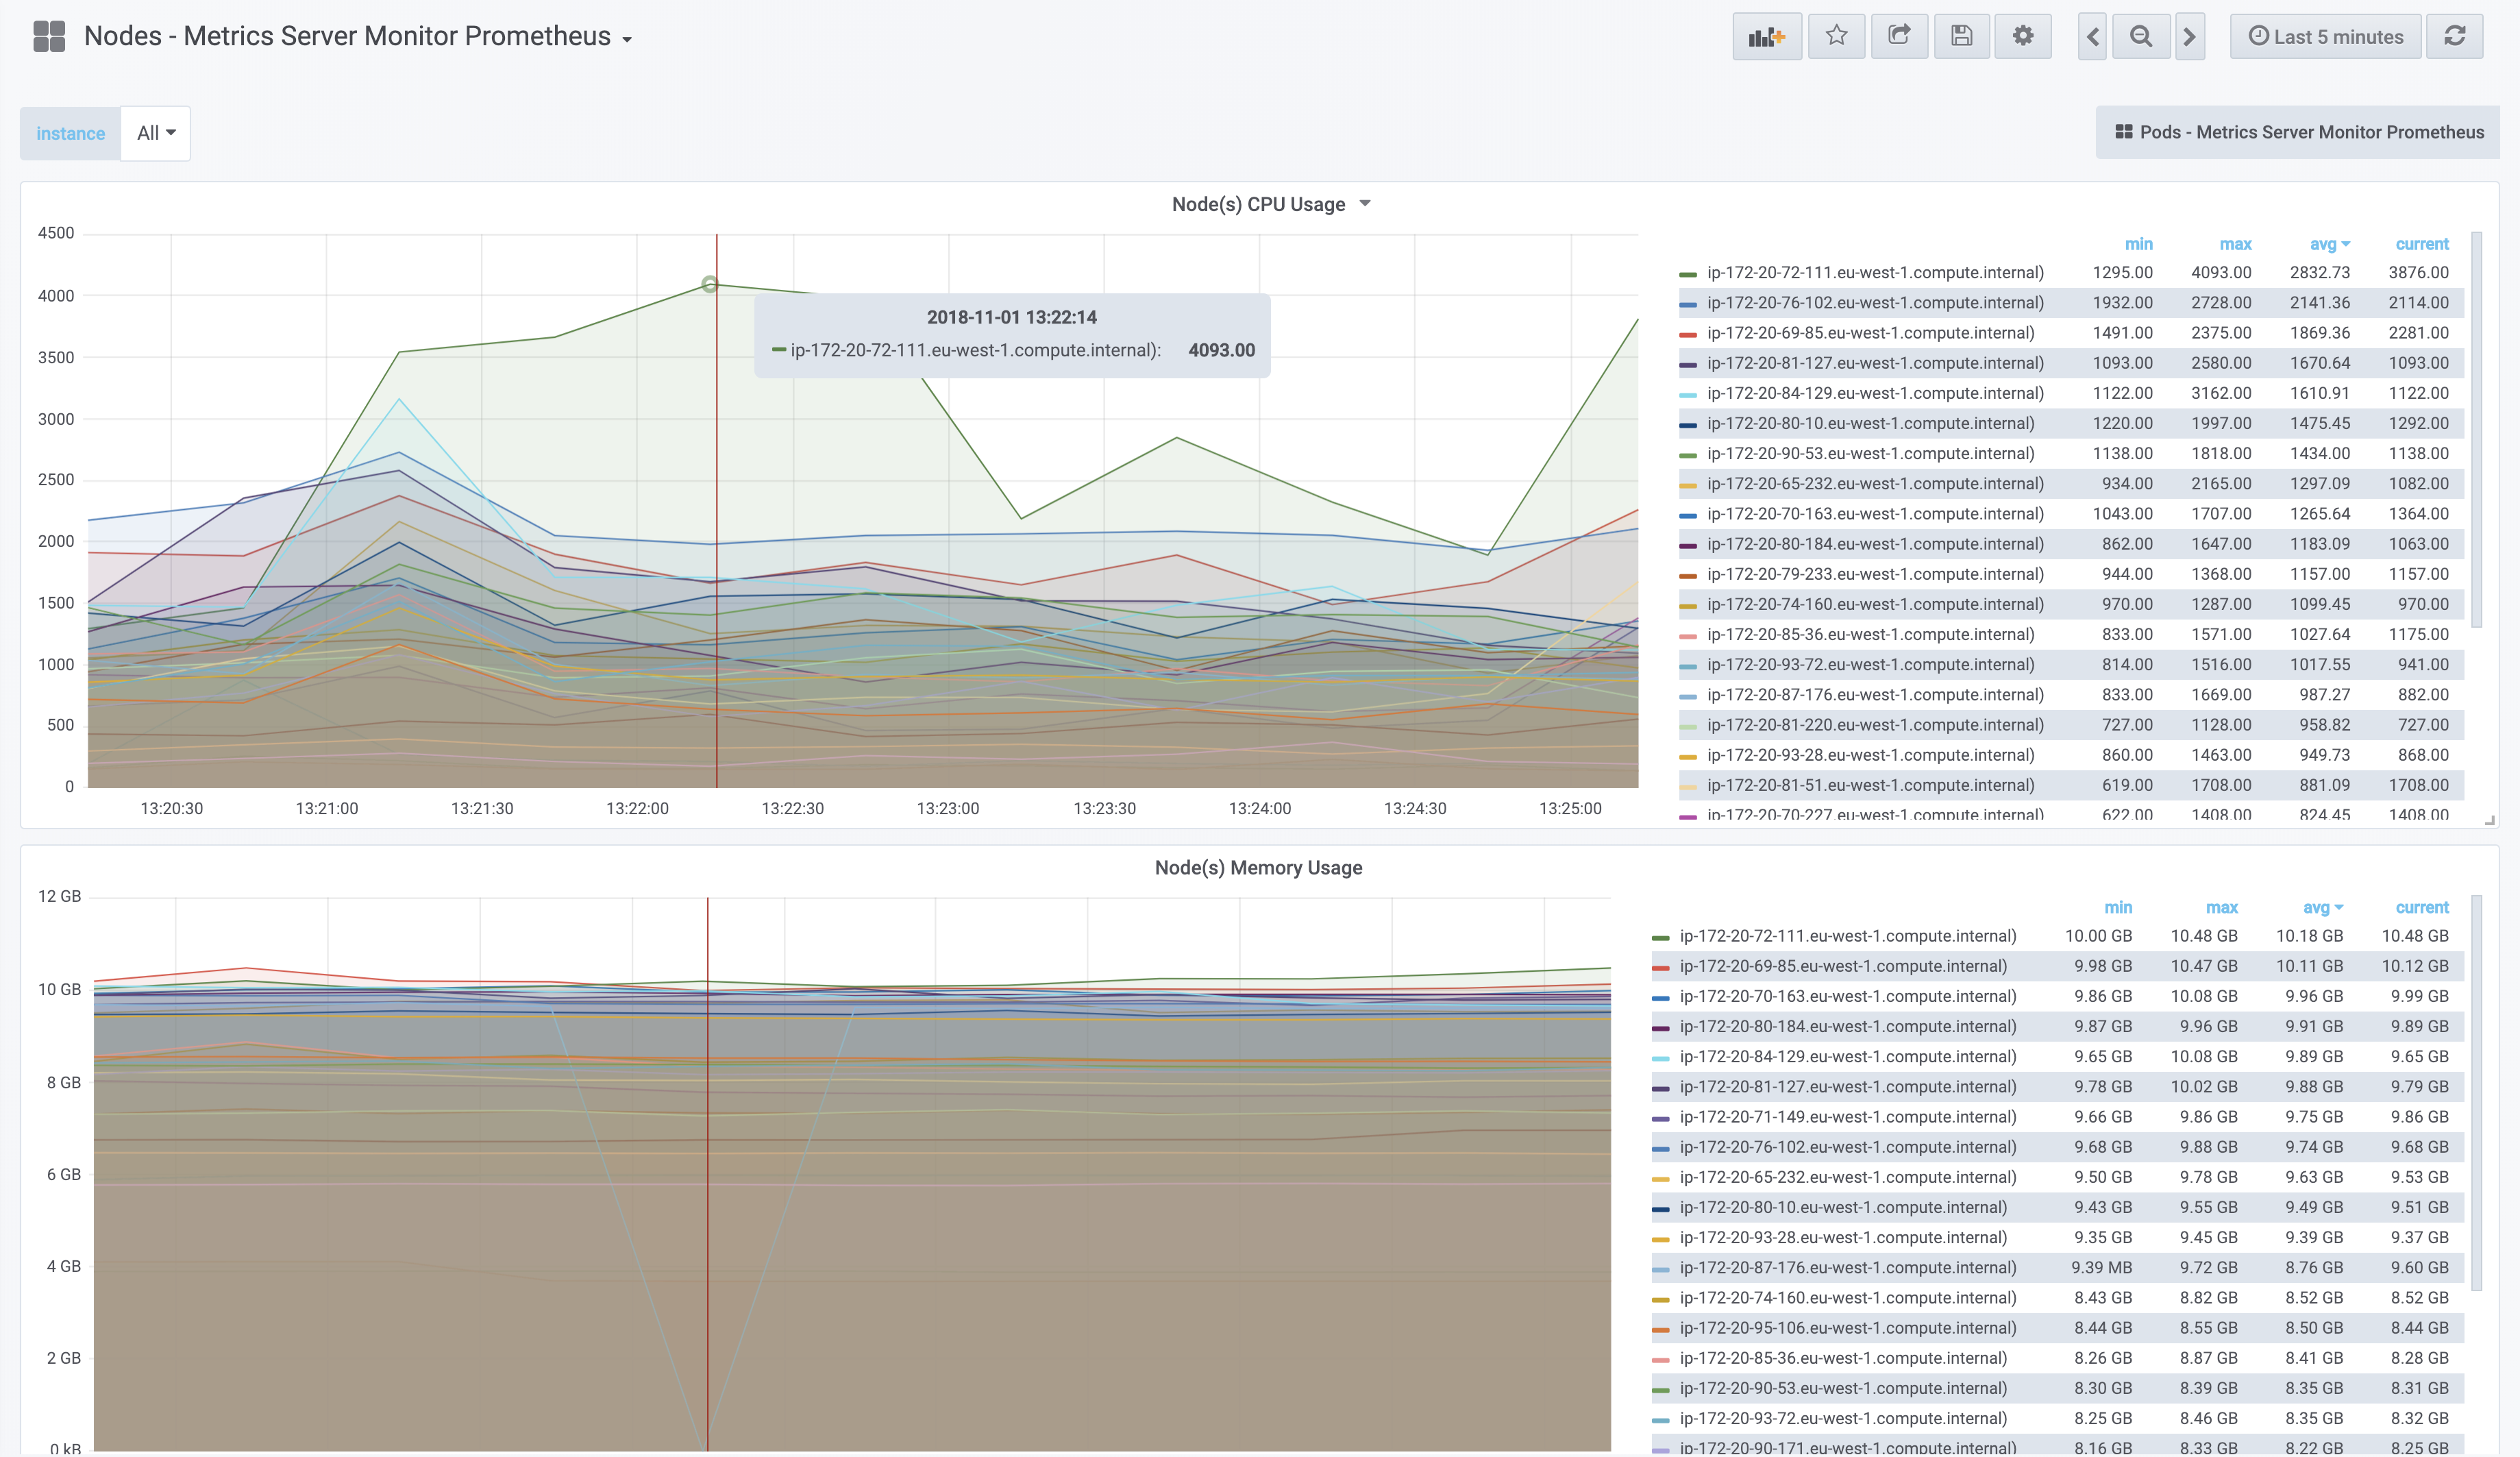
Container/node usage exporter that collects data from heapster/metrics-server using low resources. An alternative to prometheus/node_exporter.
Screenshots
Used Metrics 22
metrics_server_node_cpu_usage
metrics_server_node_memory_usage
Get Dashboard✕
Download
Copy to Clipboard