Node Metrics 1,6001,600 3.0 (1 reviews)
1/28/2017
2/16/2017
2
Host Metrics
>=4.1.1
Prometheus
Description
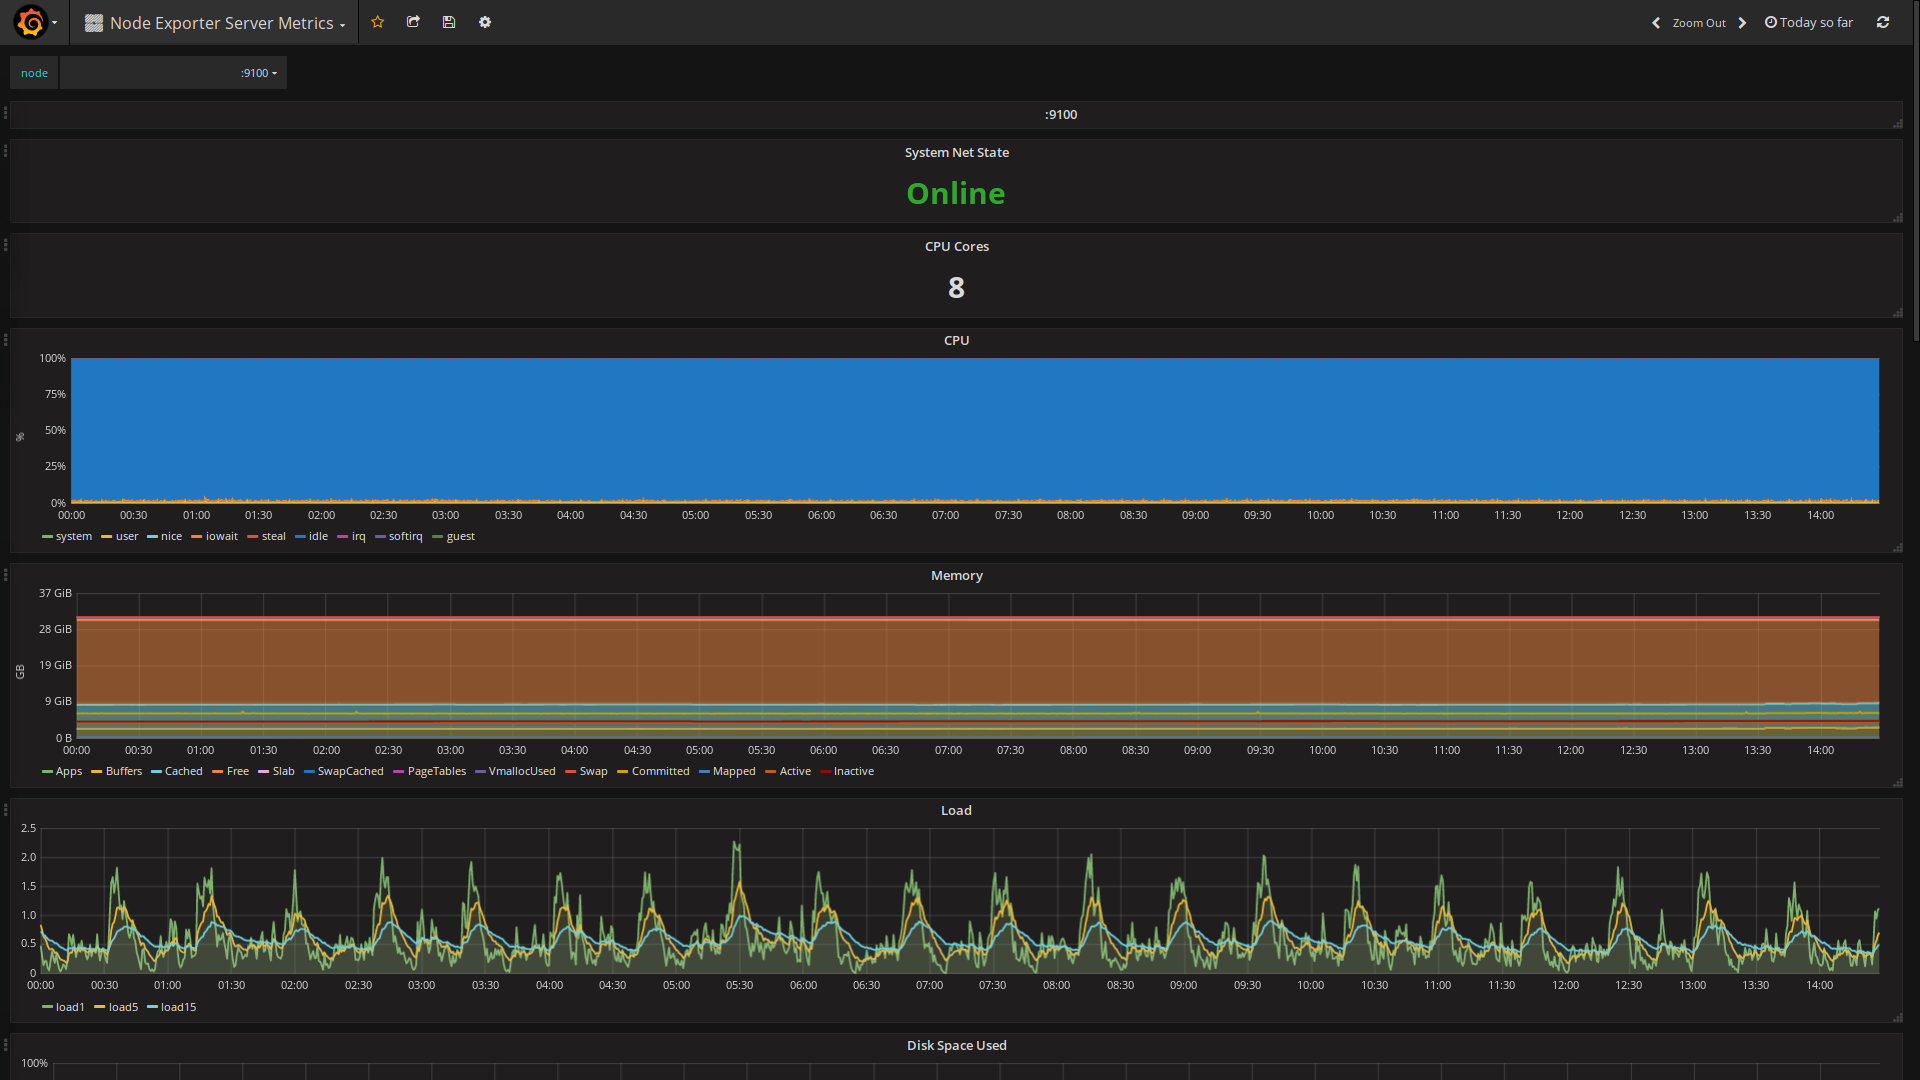
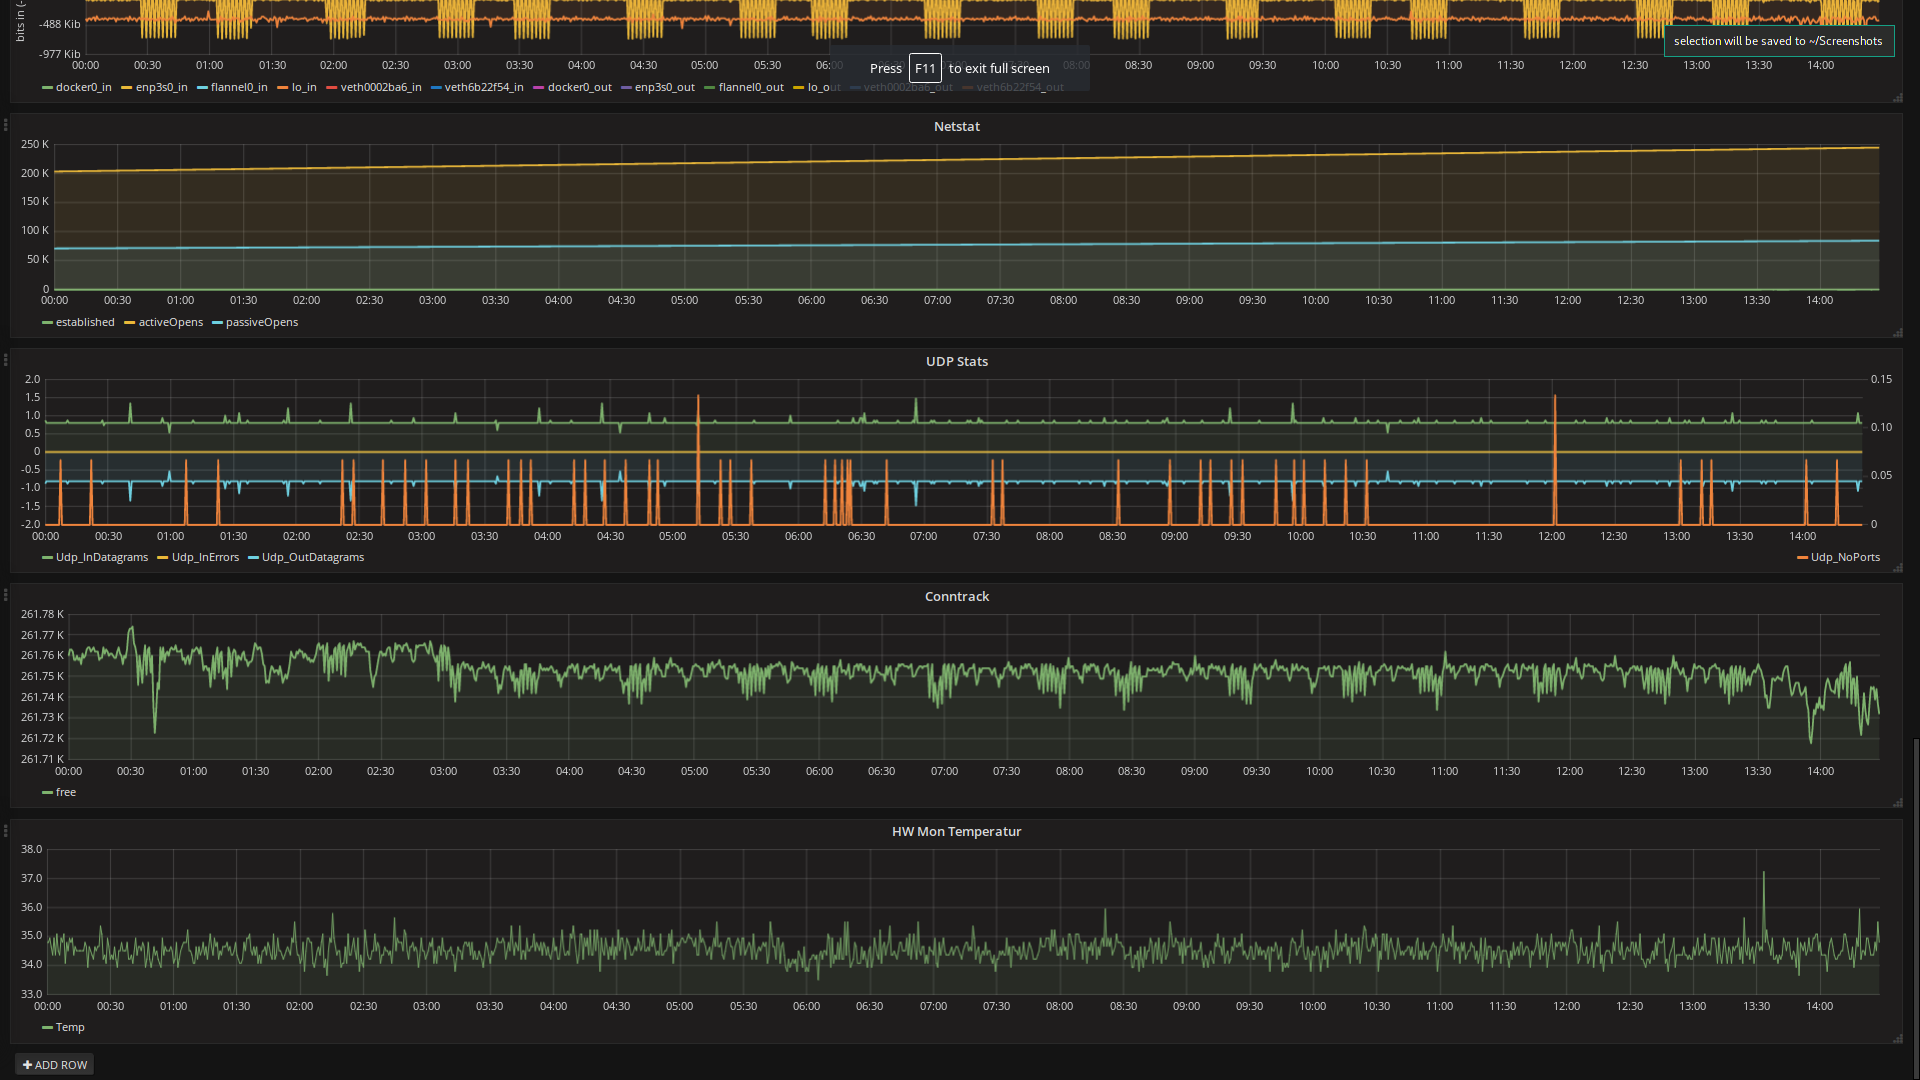
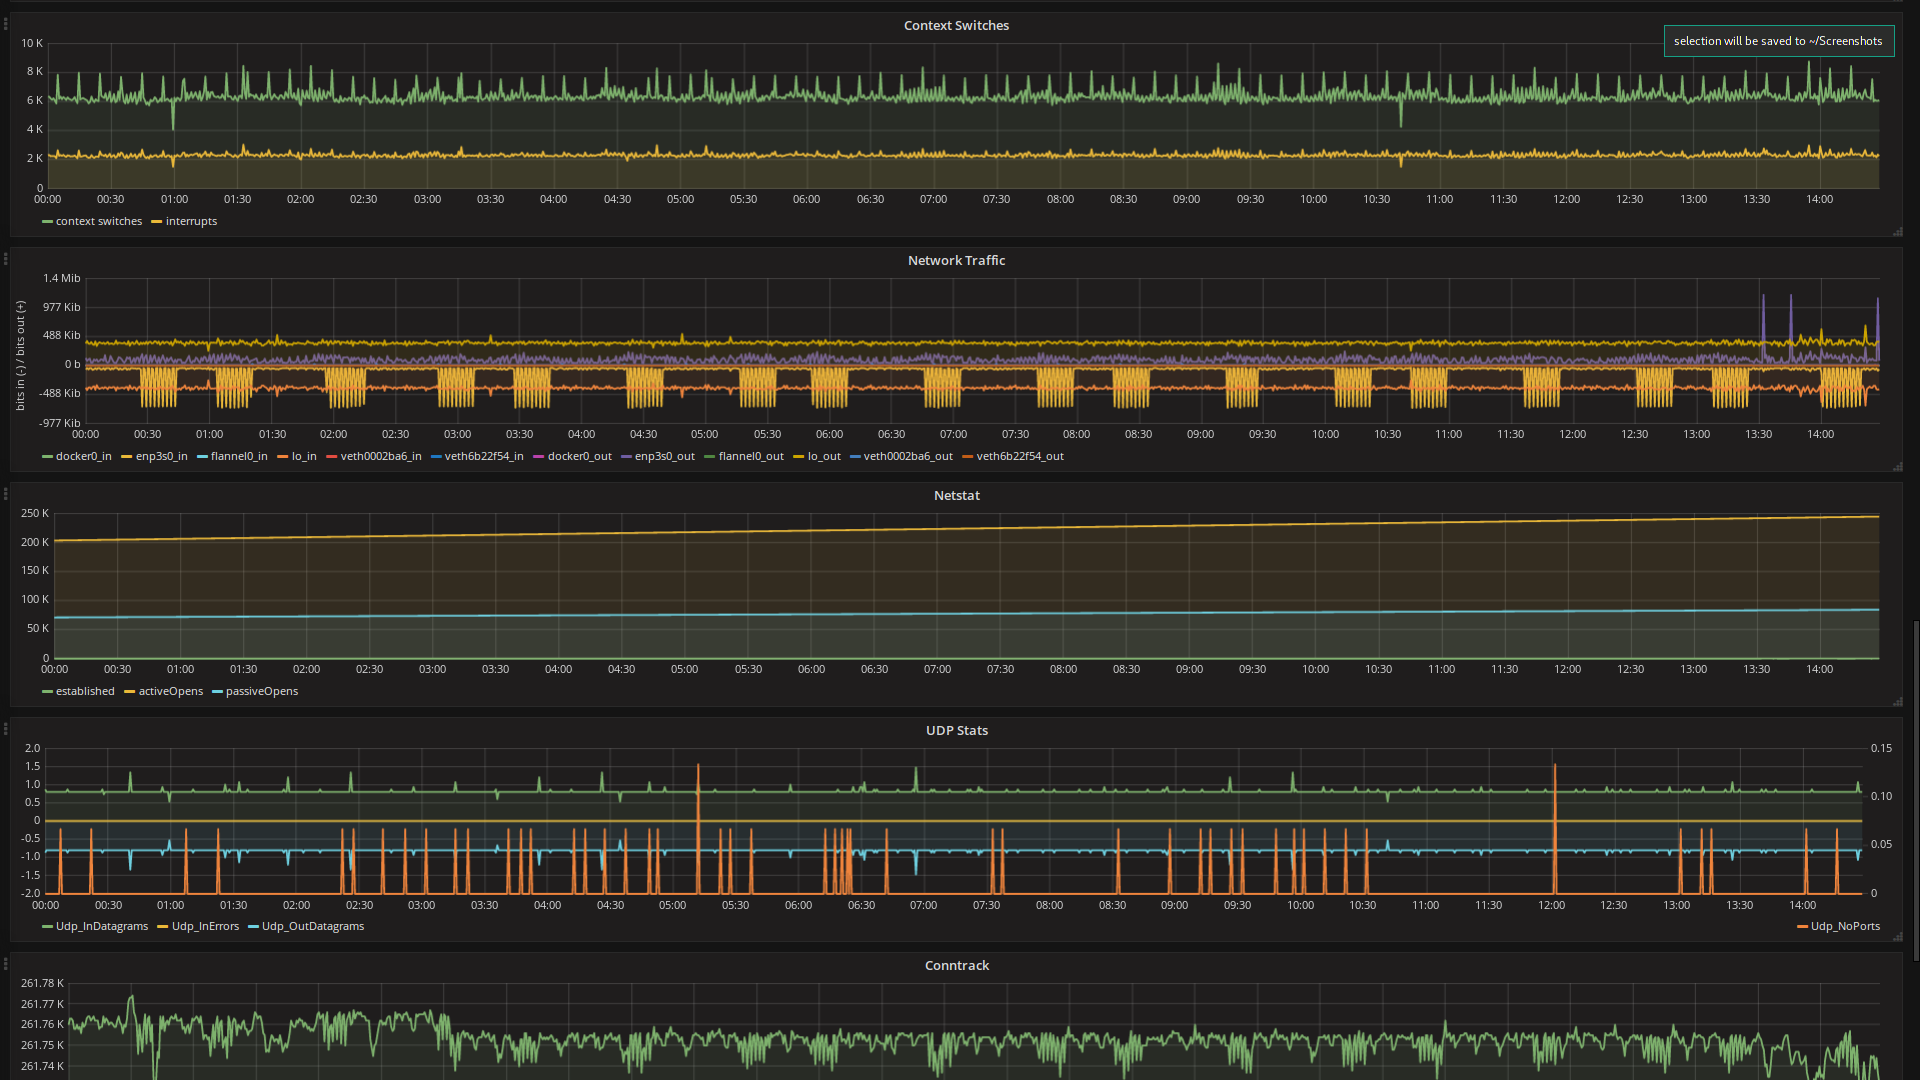
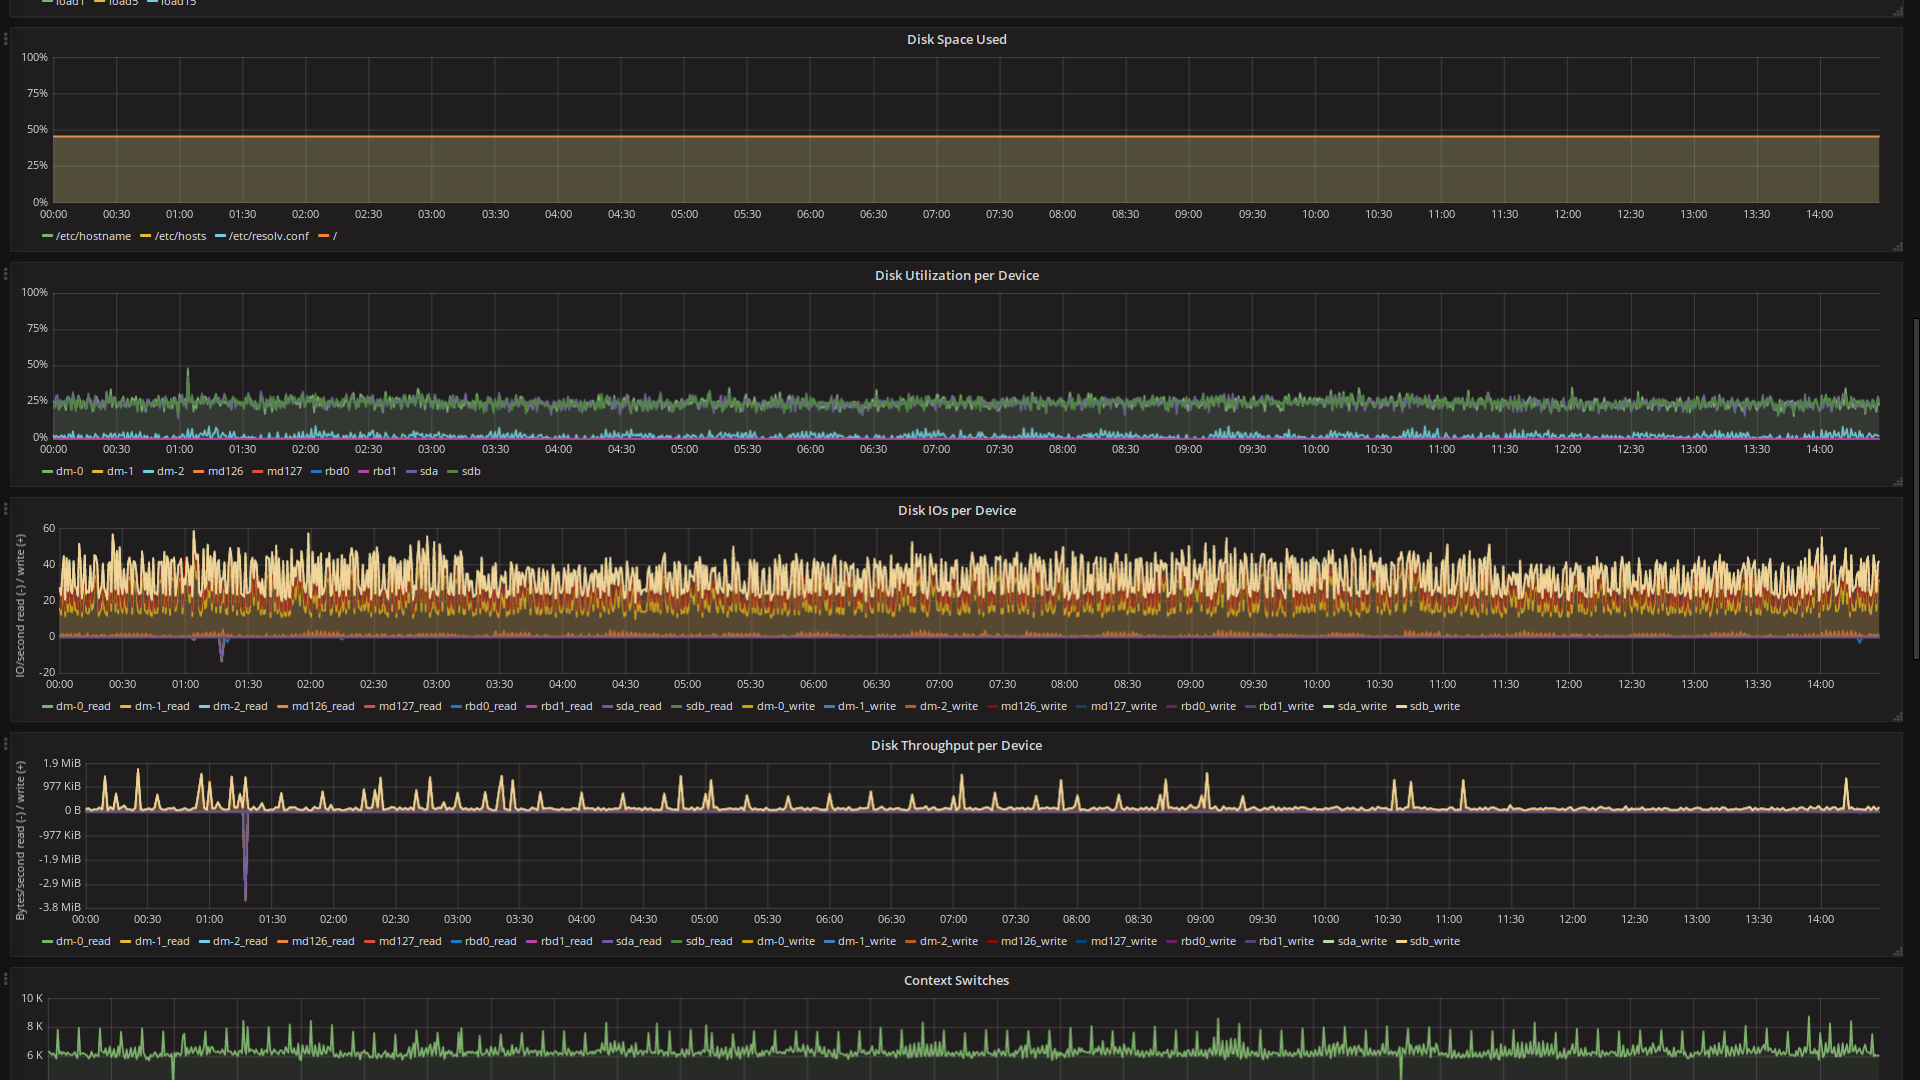
Dashboard to view multiple servers
Screenshots
Get Dashboard✕
Download
Copy to Clipboard
Dashboard to view multiple servers