Node Exporter - USE Method / Node 1,3351,335
2/26/2021
2/26/2021
1
>=7.4.3
Description
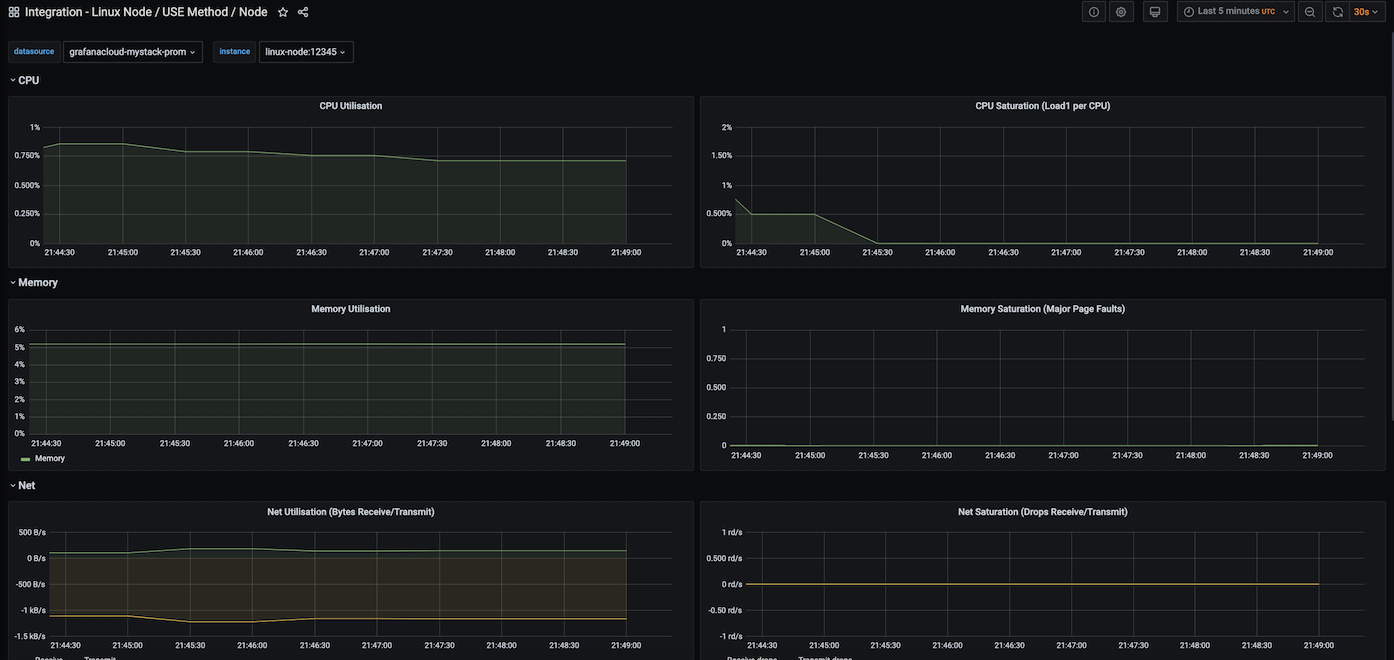
The USE Method / Node Dashboard for the Prometheus Node Exporter
Screenshots
Get Dashboard✕
Download
Copy to Clipboard
The USE Method / Node Dashboard for the Prometheus Node Exporter